Asian vs Immigrants from Denmark 6th Grade
COMPARE
Asian
Immigrants from Denmark
6th Grade
6th Grade Comparison
Asians
Immigrants from Denmark
96.6%
6TH GRADE
2.4/ 100
METRIC RATING
235th/ 347
METRIC RANK
97.5%
6TH GRADE
98.5/ 100
METRIC RATING
98th/ 347
METRIC RANK
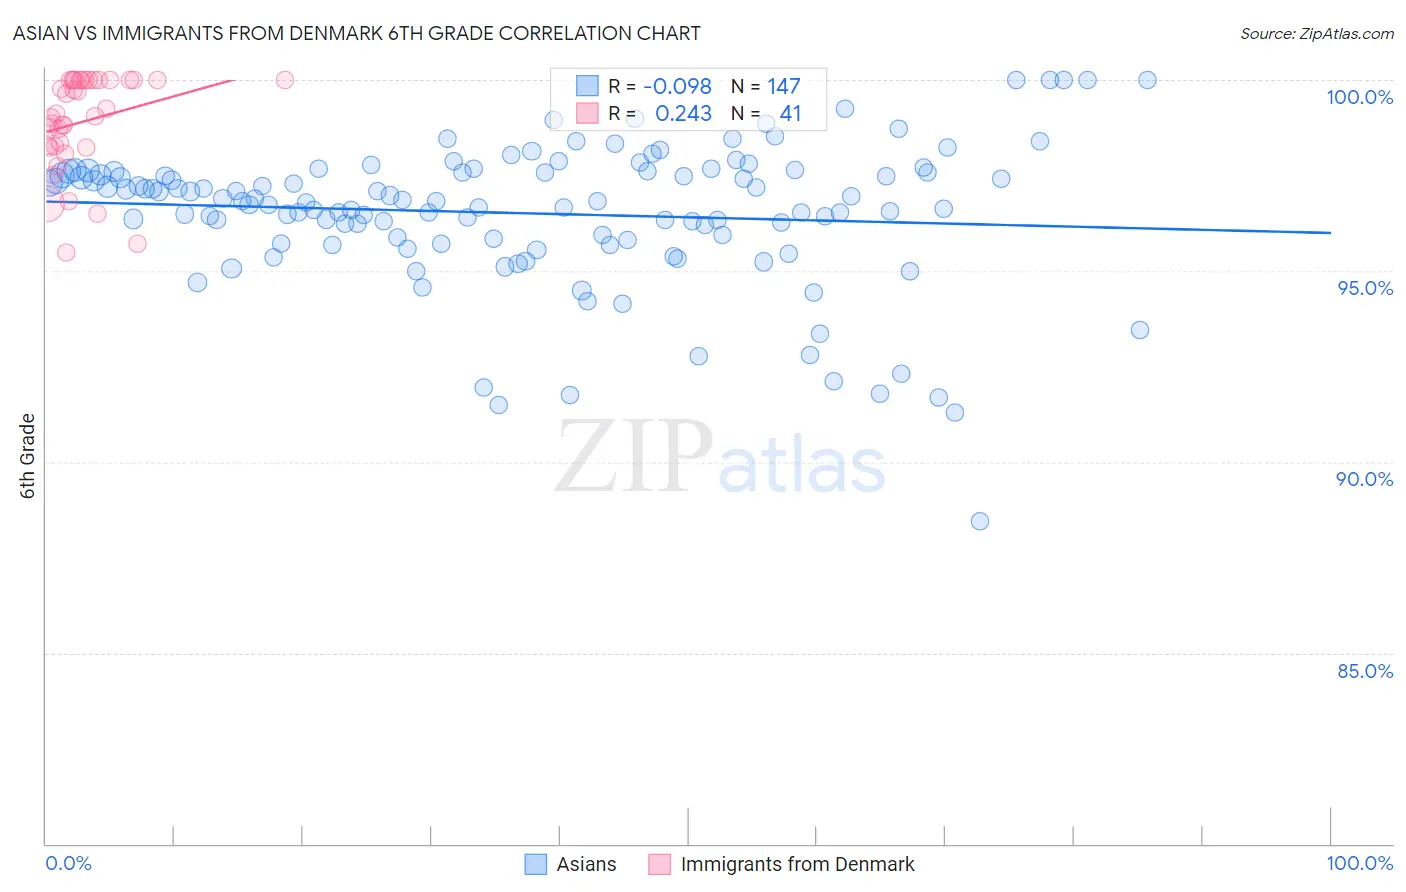
Asian vs Immigrants from Denmark 6th Grade Correlation Chart
The statistical analysis conducted on geographies consisting of 550,801,467 people shows a slight negative correlation between the proportion of Asians and percentage of population with at least 6th grade education in the United States with a correlation coefficient (R) of -0.098 and weighted average of 96.6%. Similarly, the statistical analysis conducted on geographies consisting of 136,430,932 people shows a weak positive correlation between the proportion of Immigrants from Denmark and percentage of population with at least 6th grade education in the United States with a correlation coefficient (R) of 0.243 and weighted average of 97.5%, a difference of 0.91%.
6th Grade Correlation Summary
| Measurement | Asian | Immigrants from Denmark |
| Minimum | 88.5% | 95.5% |
| Maximum | 100.0% | 100.0% |
| Range | 11.5% | 4.5% |
| Mean | 96.5% | 98.9% |
| Median | 96.8% | 99.1% |
| Interquartile 25% (IQ1) | 95.8% | 98.3% |
| Interquartile 75% (IQ3) | 97.6% | 100.0% |
| Interquartile Range (IQR) | 1.8% | 1.7% |
| Standard Deviation (Sample) | 1.9% | 1.3% |
| Standard Deviation (Population) | 1.9% | 1.2% |
Similar Demographics by 6th Grade
Demographics Similar to Asians by 6th Grade
In terms of 6th grade, the demographic groups most similar to Asians are Uruguayan (96.6%, a difference of 0.0%), Immigrants from Indonesia (96.6%, a difference of 0.010%), Immigrants from Eastern Africa (96.6%, a difference of 0.020%), Yuman (96.7%, a difference of 0.030%), and Nigerian (96.6%, a difference of 0.030%).
| Demographics | Rating | Rank | 6th Grade |
| Immigrants | Malaysia | 4.0 /100 | #228 | Tragic 96.7% |
| Assyrians/Chaldeans/Syriacs | 4.0 /100 | #229 | Tragic 96.7% |
| Immigrants | Eastern Asia | 4.0 /100 | #230 | Tragic 96.7% |
| Sub-Saharan Africans | 3.5 /100 | #231 | Tragic 96.7% |
| South American Indians | 3.5 /100 | #232 | Tragic 96.7% |
| Yuman | 3.2 /100 | #233 | Tragic 96.7% |
| Uruguayans | 2.5 /100 | #234 | Tragic 96.6% |
| Asians | 2.4 /100 | #235 | Tragic 96.6% |
| Immigrants | Indonesia | 2.3 /100 | #236 | Tragic 96.6% |
| Immigrants | Eastern Africa | 2.0 /100 | #237 | Tragic 96.6% |
| Nigerians | 1.9 /100 | #238 | Tragic 96.6% |
| Indians (Asian) | 1.9 /100 | #239 | Tragic 96.6% |
| Koreans | 1.9 /100 | #240 | Tragic 96.6% |
| Senegalese | 1.8 /100 | #241 | Tragic 96.6% |
| Immigrants | Asia | 1.8 /100 | #242 | Tragic 96.6% |
Demographics Similar to Immigrants from Denmark by 6th Grade
In terms of 6th grade, the demographic groups most similar to Immigrants from Denmark are Yugoslavian (97.5%, a difference of 0.0%), Romanian (97.5%, a difference of 0.010%), Cree (97.5%, a difference of 0.010%), Cypriot (97.5%, a difference of 0.010%), and Immigrants from Ireland (97.5%, a difference of 0.010%).
| Demographics | Rating | Rank | 6th Grade |
| Immigrants | Western Europe | 98.8 /100 | #91 | Exceptional 97.5% |
| Romanians | 98.7 /100 | #92 | Exceptional 97.5% |
| Cree | 98.7 /100 | #93 | Exceptional 97.5% |
| Cypriots | 98.7 /100 | #94 | Exceptional 97.5% |
| Immigrants | Ireland | 98.7 /100 | #95 | Exceptional 97.5% |
| Immigrants | Germany | 98.6 /100 | #96 | Exceptional 97.5% |
| Immigrants | Sweden | 98.6 /100 | #97 | Exceptional 97.5% |
| Immigrants | Denmark | 98.5 /100 | #98 | Exceptional 97.5% |
| Yugoslavians | 98.5 /100 | #99 | Exceptional 97.5% |
| Turks | 98.3 /100 | #100 | Exceptional 97.5% |
| South Africans | 98.2 /100 | #101 | Exceptional 97.5% |
| Choctaw | 98.0 /100 | #102 | Exceptional 97.5% |
| Bhutanese | 98.0 /100 | #103 | Exceptional 97.5% |
| German Russians | 97.9 /100 | #104 | Exceptional 97.5% |
| Cheyenne | 97.9 /100 | #105 | Exceptional 97.5% |