Armenian vs Immigrants from Ukraine 10th Grade
COMPARE
Armenian
Immigrants from Ukraine
10th Grade
10th Grade Comparison
Armenians
Immigrants from Ukraine
92.7%
10TH GRADE
0.9/ 100
METRIC RATING
254th/ 347
METRIC RANK
94.0%
10TH GRADE
81.5/ 100
METRIC RATING
147th/ 347
METRIC RANK
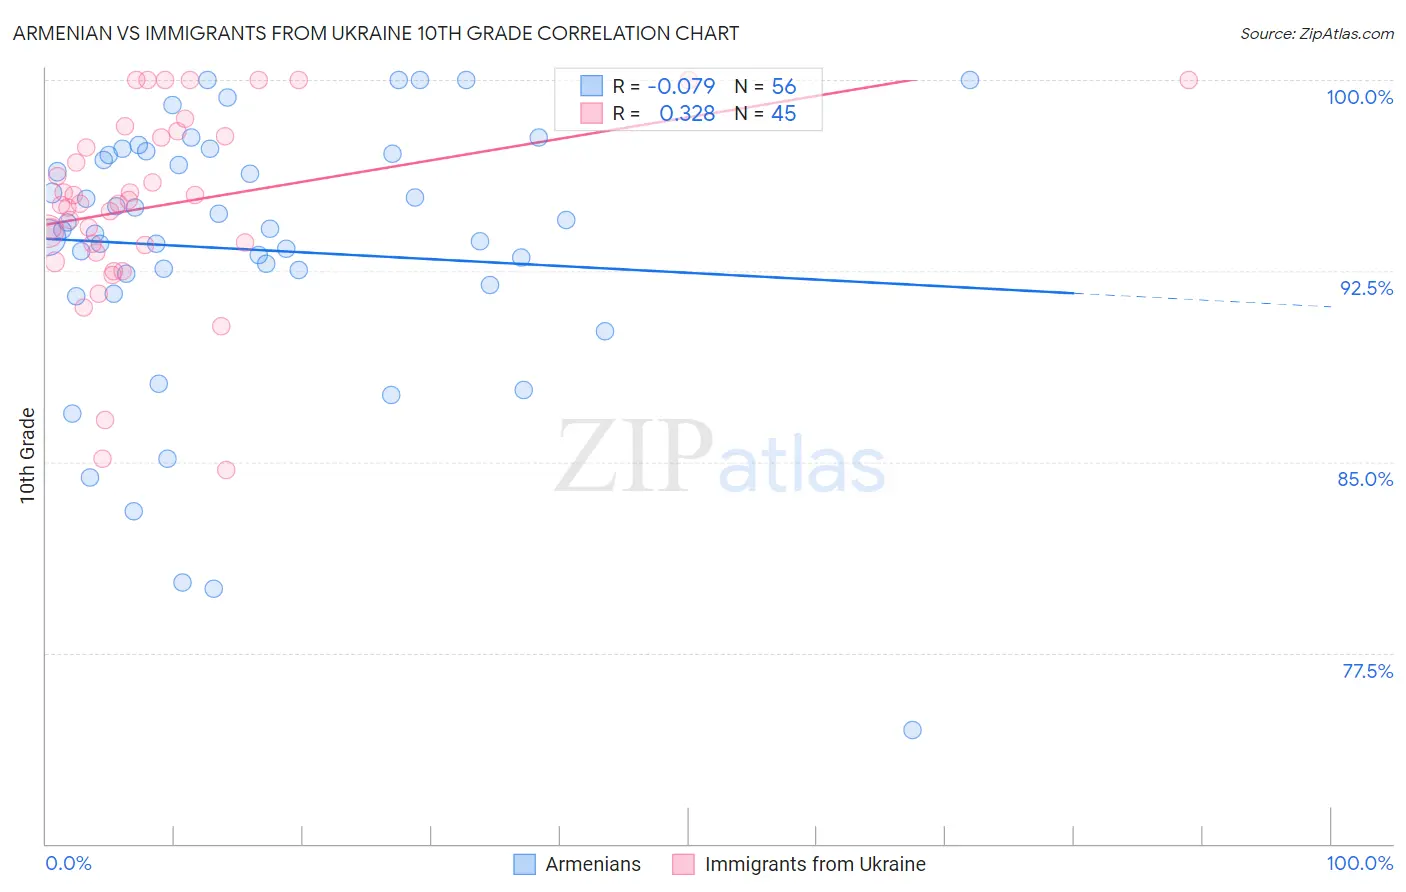
Armenian vs Immigrants from Ukraine 10th Grade Correlation Chart
The statistical analysis conducted on geographies consisting of 310,954,685 people shows a slight negative correlation between the proportion of Armenians and percentage of population with at least 10th grade education in the United States with a correlation coefficient (R) of -0.079 and weighted average of 92.7%. Similarly, the statistical analysis conducted on geographies consisting of 289,714,613 people shows a mild positive correlation between the proportion of Immigrants from Ukraine and percentage of population with at least 10th grade education in the United States with a correlation coefficient (R) of 0.328 and weighted average of 94.0%, a difference of 1.4%.
10th Grade Correlation Summary
| Measurement | Armenian | Immigrants from Ukraine |
| Minimum | 74.5% | 84.7% |
| Maximum | 100.0% | 100.0% |
| Range | 25.5% | 15.3% |
| Mean | 93.3% | 95.1% |
| Median | 94.1% | 95.2% |
| Interquartile 25% (IQ1) | 92.2% | 93.4% |
| Interquartile 75% (IQ3) | 97.1% | 97.9% |
| Interquartile Range (IQR) | 4.9% | 4.5% |
| Standard Deviation (Sample) | 5.4% | 3.7% |
| Standard Deviation (Population) | 5.3% | 3.7% |
Similar Demographics by 10th Grade
Demographics Similar to Armenians by 10th Grade
In terms of 10th grade, the demographic groups most similar to Armenians are South American (92.8%, a difference of 0.010%), Ghanaian (92.8%, a difference of 0.010%), Immigrants from Thailand (92.8%, a difference of 0.020%), Immigrants from Bolivia (92.7%, a difference of 0.050%), and Immigrants from Nigeria (92.7%, a difference of 0.060%).
| Demographics | Rating | Rank | 10th Grade |
| Immigrants | Afghanistan | 1.4 /100 | #247 | Tragic 92.8% |
| Colombians | 1.4 /100 | #248 | Tragic 92.8% |
| Immigrants | Senegal | 1.4 /100 | #249 | Tragic 92.8% |
| Jamaicans | 1.2 /100 | #250 | Tragic 92.8% |
| Immigrants | Thailand | 1.0 /100 | #251 | Tragic 92.8% |
| South Americans | 0.9 /100 | #252 | Tragic 92.8% |
| Ghanaians | 0.9 /100 | #253 | Tragic 92.8% |
| Armenians | 0.9 /100 | #254 | Tragic 92.7% |
| Immigrants | Bolivia | 0.7 /100 | #255 | Tragic 92.7% |
| Immigrants | Nigeria | 0.7 /100 | #256 | Tragic 92.7% |
| U.S. Virgin Islanders | 0.7 /100 | #257 | Tragic 92.7% |
| Immigrants | Costa Rica | 0.6 /100 | #258 | Tragic 92.7% |
| Immigrants | Jamaica | 0.5 /100 | #259 | Tragic 92.6% |
| Immigrants | Uzbekistan | 0.5 /100 | #260 | Tragic 92.6% |
| Paiute | 0.4 /100 | #261 | Tragic 92.6% |
Demographics Similar to Immigrants from Ukraine by 10th Grade
In terms of 10th grade, the demographic groups most similar to Immigrants from Ukraine are Arab (94.0%, a difference of 0.010%), Ugandan (94.0%, a difference of 0.010%), Chickasaw (94.1%, a difference of 0.020%), Egyptian (94.0%, a difference of 0.030%), and Kenyan (94.0%, a difference of 0.030%).
| Demographics | Rating | Rank | 10th Grade |
| Immigrants | Jordan | 87.6 /100 | #140 | Excellent 94.1% |
| Hmong | 86.6 /100 | #141 | Excellent 94.1% |
| Albanians | 86.5 /100 | #142 | Excellent 94.1% |
| Cherokee | 84.9 /100 | #143 | Excellent 94.1% |
| Immigrants | Kazakhstan | 84.9 /100 | #144 | Excellent 94.1% |
| Immigrants | Nonimmigrants | 83.8 /100 | #145 | Excellent 94.1% |
| Chickasaw | 82.6 /100 | #146 | Excellent 94.1% |
| Immigrants | Ukraine | 81.5 /100 | #147 | Excellent 94.0% |
| Arabs | 80.9 /100 | #148 | Excellent 94.0% |
| Ugandans | 80.7 /100 | #149 | Excellent 94.0% |
| Egyptians | 79.6 /100 | #150 | Good 94.0% |
| Kenyans | 79.1 /100 | #151 | Good 94.0% |
| Immigrants | Italy | 78.0 /100 | #152 | Good 94.0% |
| Immigrants | Brazil | 75.5 /100 | #153 | Good 94.0% |
| Immigrants | Kenya | 75.3 /100 | #154 | Good 94.0% |