Arab vs Yaqui 11th Grade
COMPARE
Arab
Yaqui
11th Grade
11th Grade Comparison
Arabs
Yaqui
92.9%
11TH GRADE
85.4/ 100
METRIC RATING
137th/ 347
METRIC RANK
89.5%
11TH GRADE
0.0/ 100
METRIC RATING
310th/ 347
METRIC RANK
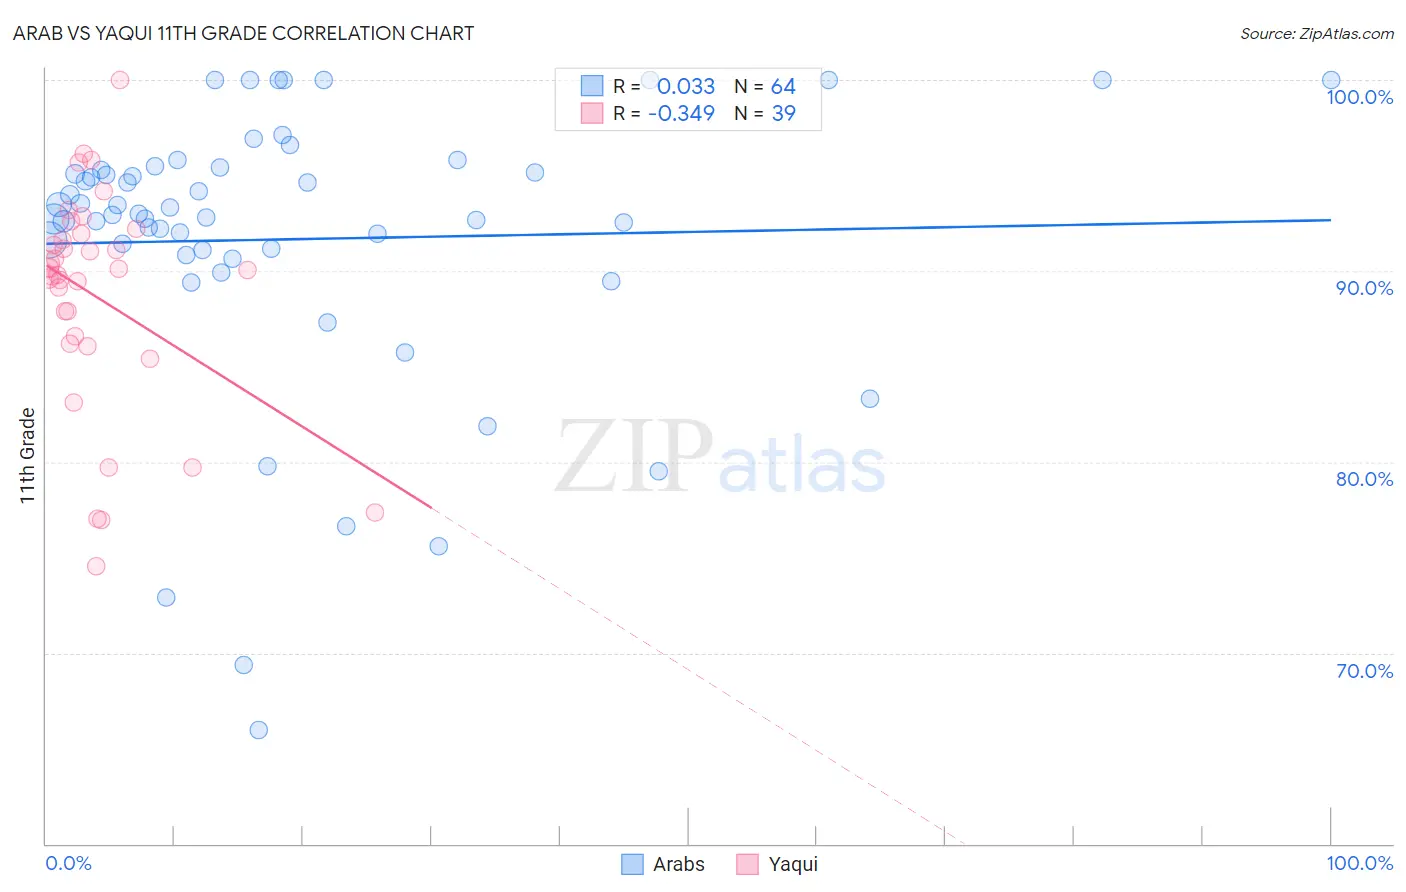
Arab vs Yaqui 11th Grade Correlation Chart
The statistical analysis conducted on geographies consisting of 486,870,847 people shows no correlation between the proportion of Arabs and percentage of population with at least 11th grade education in the United States with a correlation coefficient (R) of 0.033 and weighted average of 92.9%. Similarly, the statistical analysis conducted on geographies consisting of 107,725,021 people shows a mild negative correlation between the proportion of Yaqui and percentage of population with at least 11th grade education in the United States with a correlation coefficient (R) of -0.349 and weighted average of 89.5%, a difference of 3.8%.
11th Grade Correlation Summary
| Measurement | Arab | Yaqui |
| Minimum | 66.0% | 74.5% |
| Maximum | 100.0% | 100.0% |
| Range | 34.0% | 25.5% |
| Mean | 91.7% | 88.7% |
| Median | 93.0% | 90.0% |
| Interquartile 25% (IQ1) | 91.0% | 86.2% |
| Interquartile 75% (IQ3) | 95.3% | 91.9% |
| Interquartile Range (IQR) | 4.4% | 5.7% |
| Standard Deviation (Sample) | 7.4% | 5.8% |
| Standard Deviation (Population) | 7.3% | 5.7% |
Similar Demographics by 11th Grade
Demographics Similar to Arabs by 11th Grade
In terms of 11th grade, the demographic groups most similar to Arabs are Cree (92.9%, a difference of 0.010%), Immigrants from Brazil (92.9%, a difference of 0.010%), Immigrants from Italy (92.9%, a difference of 0.020%), Crow (92.9%, a difference of 0.030%), and Mongolian (93.0%, a difference of 0.040%).
| Demographics | Rating | Rank | 11th Grade |
| Albanians | 89.5 /100 | #130 | Excellent 93.0% |
| Egyptians | 89.5 /100 | #131 | Excellent 93.0% |
| Immigrants | Bosnia and Herzegovina | 89.0 /100 | #132 | Excellent 93.0% |
| Mongolians | 87.6 /100 | #133 | Excellent 93.0% |
| Delaware | 87.3 /100 | #134 | Excellent 93.0% |
| Immigrants | Italy | 86.6 /100 | #135 | Excellent 92.9% |
| Cree | 85.9 /100 | #136 | Excellent 92.9% |
| Arabs | 85.4 /100 | #137 | Excellent 92.9% |
| Immigrants | Brazil | 85.1 /100 | #138 | Excellent 92.9% |
| Crow | 84.1 /100 | #139 | Excellent 92.9% |
| Venezuelans | 83.4 /100 | #140 | Excellent 92.9% |
| Chileans | 83.0 /100 | #141 | Excellent 92.9% |
| Kenyans | 82.0 /100 | #142 | Excellent 92.9% |
| Ugandans | 81.4 /100 | #143 | Excellent 92.9% |
| Assyrians/Chaldeans/Syriacs | 80.5 /100 | #144 | Excellent 92.8% |
Demographics Similar to Yaqui by 11th Grade
In terms of 11th grade, the demographic groups most similar to Yaqui are Immigrants from Bangladesh (89.5%, a difference of 0.010%), Nepalese (89.5%, a difference of 0.030%), Immigrants from Dominica (89.5%, a difference of 0.060%), Vietnamese (89.4%, a difference of 0.060%), and Ecuadorian (89.6%, a difference of 0.11%).
| Demographics | Rating | Rank | 11th Grade |
| Immigrants | Immigrants | 0.0 /100 | #303 | Tragic 89.7% |
| Yuman | 0.0 /100 | #304 | Tragic 89.7% |
| Immigrants | Cambodia | 0.0 /100 | #305 | Tragic 89.6% |
| Ecuadorians | 0.0 /100 | #306 | Tragic 89.6% |
| Immigrants | Dominica | 0.0 /100 | #307 | Tragic 89.5% |
| Nepalese | 0.0 /100 | #308 | Tragic 89.5% |
| Immigrants | Bangladesh | 0.0 /100 | #309 | Tragic 89.5% |
| Yaqui | 0.0 /100 | #310 | Tragic 89.5% |
| Vietnamese | 0.0 /100 | #311 | Tragic 89.4% |
| Immigrants | Portugal | 0.0 /100 | #312 | Tragic 89.3% |
| Immigrants | Caribbean | 0.0 /100 | #313 | Tragic 89.1% |
| Cape Verdeans | 0.0 /100 | #314 | Tragic 89.1% |
| Immigrants | Ecuador | 0.0 /100 | #315 | Tragic 89.1% |
| Immigrants | Cuba | 0.0 /100 | #316 | Tragic 88.9% |
| Lumbee | 0.0 /100 | #317 | Tragic 88.9% |