Arab vs Immigrants from Ireland 12th Grade, No Diploma

COMPARE

Arab
Race
Ancestry
AfghanAfricanAlaska NativeAlaskan AthabascanAlbanianAleutAlsatianAmericanApacheArabArapahoArgentineanArmenianAssyrian/Chaldean/SyriacAustralianAustrianBahamianBangladeshiBarbadianBasqueBelgianBelizeanBermudanBhutaneseBlackfeetBolivianBrazilianBritishBritish West IndianBulgarianBurmeseCajunCambodianCanadianCape VerdeanCarpatho RusynCelticCentral AmericanCentral American IndianCherokeeCheyenneChickasawChileanChineseChippewaChoctawColombianColvilleComancheCosta RicanCreeCreekCroatianCrowCubanCypriotCzechCzechoslovakianDanishDelawareDominicanDutchDutch West IndianEastern EuropeanEcuadorianEgyptianEnglishEstonianEthiopianEuropeanFijianFilipinoFinnishFrenchFrench American IndianFrench CanadianGermanGerman RussianGhanaianGreekGuamanian/ChamorroGuatemalanGuyaneseHaitianHmongHonduranHopiHoumaHungarianIcelanderIndian (Asian)IndonesianInupiatIranianIraqiIrishIroquoisIsraeliItalianJamaicanJapaneseJordanianKenyanKiowaKoreanLaotianLatvianLebaneseLiberianLithuanianLumbeeLuxembourgerMacedonianMalaysianMalteseMarshalleseMenomineeMexicanMexican American IndianMongolianMoroccanNative HawaiianNavajoNepaleseNew ZealanderNicaraguanNigerianNorthern EuropeanNorwegianOkinawanOsageOttawaPaiutePakistaniPalestinianPanamanianParaguayanPennsylvania GermanPeruvianPimaPolishPortuguesePotawatomiPuebloPuerto RicanPuget Sound SalishRomanianRussianSalvadoranSamoanScandinavianScotch-IrishScottishSeminoleSenegaleseSerbianShoshoneSierra LeoneanSiouxSlavicSlovakSloveneSomaliSouth AfricanSouth AmericanSouth American IndianSoviet UnionSpaniardSpanishSpanish AmericanSpanish American IndianSri LankanSubsaharan AfricanSudaneseSwedishSwissSyrianTaiwaneseThaiTlingit-HaidaTohono O'OdhamTonganTrinidadian and TobagonianTsimshianTurkishU.S. Virgin IslanderUgandanUkrainianUruguayanUteVenezuelanVietnameseWelshWest IndianYakamaYaquiYugoslavianYumanYup'ikZimbabwean
Immigration
NonimmigrantsImmigrantsAfghanistanAfricaAlbaniaArgentinaArmeniaAsiaAustraliaAustriaBahamasBangladeshBarbadosBelarusBelgiumBelizeBoliviaBosnia and HerzegovinaBrazilBulgariaBurma/MyanmarCabo VerdeCambodiaCameroonCanadaCaribbeanCentral AmericaChileChinaColombiaCongoCosta RicaCroatiaCubaCzechoslovakiaDenmarkDominicaDominican RepublicEastern AfricaEastern AsiaEastern EuropeEcuadorEgyptEl SalvadorEnglandEritreaEthiopiaEuropeFijiFranceGermanyGhanaGreeceGrenadaGuatemalaGuyanaHaitiHondurasHong KongHungaryIndiaIndonesiaIranIraqIsraelItalyJamaicaJapanJordanKazakhstanKenyaKoreaKuwaitLaosLatin AmericaLatviaLebanonLiberiaLithuaniaMalaysiaMexicoMicronesiaMiddle AfricaMoldovaMoroccoNepalNetherlandsNicaraguaNigeriaNorth AmericaNorth MacedoniaNorthern AfricaNorthern EuropeNorwayOceaniaPakistanPanamaPeruPhilippinesPolandPortugalRomaniaRussiaSaudi ArabiaScotlandSenegalSerbiaSierra LeoneSingaporeSomaliaSouth AfricaSouth AmericaSouth Central AsiaSouth Eastern AsiaSouthern EuropeSpainSri LankaSt. Vincent and the GrenadinesSudanSwedenSwitzerlandSyriaTaiwanThailandTrinidad and TobagoTurkeyUgandaUkraineUruguayUzbekistanVenezuelaVietnamWest IndiesWestern AfricaWestern AsiaWestern EuropeYemenZaireZimbabweAzores
Immigrants from Ireland
Race
Ancestry
AfghanAfricanAlaska NativeAlaskan AthabascanAlbanianAleutAlsatianAmericanApacheArapahoArgentineanArmenianAssyrian/Chaldean/SyriacAustralianAustrianBahamianBangladeshiBarbadianBasqueBelgianBelizeanBermudanBhutaneseBlackfeetBolivianBrazilianBritishBritish West IndianBulgarianBurmeseCajunCambodianCanadianCape VerdeanCarpatho RusynCelticCentral AmericanCentral American IndianCherokeeCheyenneChickasawChileanChineseChippewaChoctawColombianColvilleComancheCosta RicanCreeCreekCroatianCrowCubanCypriotCzechCzechoslovakianDanishDelawareDominicanDutchDutch West IndianEastern EuropeanEcuadorianEgyptianEnglishEstonianEthiopianEuropeanFijianFilipinoFinnishFrenchFrench American IndianFrench CanadianGermanGerman RussianGhanaianGreekGuamanian/ChamorroGuatemalanGuyaneseHaitianHmongHonduranHopiHoumaHungarianIcelanderIndian (Asian)IndonesianInupiatIranianIraqiIrishIroquoisIsraeliItalianJamaicanJapaneseJordanianKenyanKiowaKoreanLaotianLatvianLebaneseLiberianLithuanianLumbeeLuxembourgerMacedonianMalaysianMalteseMarshalleseMenomineeMexicanMexican American IndianMongolianMoroccanNative HawaiianNavajoNepaleseNew ZealanderNicaraguanNigerianNorthern EuropeanNorwegianOkinawanOsageOttawaPaiutePakistaniPalestinianPanamanianParaguayanPennsylvania GermanPeruvianPimaPolishPortuguesePotawatomiPuebloPuerto RicanPuget Sound SalishRomanianRussianSalvadoranSamoanScandinavianScotch-IrishScottishSeminoleSenegaleseSerbianShoshoneSierra LeoneanSiouxSlavicSlovakSloveneSomaliSouth AfricanSouth AmericanSouth American IndianSoviet UnionSpaniardSpanishSpanish AmericanSpanish American IndianSri LankanSubsaharan AfricanSudaneseSwedishSwissSyrianTaiwaneseThaiTlingit-HaidaTohono O'OdhamTonganTrinidadian and TobagonianTsimshianTurkishU.S. Virgin IslanderUgandanUkrainianUruguayanUteVenezuelanVietnameseWelshWest IndianYakamaYaquiYugoslavianYumanYup'ikZimbabwean
Immigration
NonimmigrantsImmigrantsAfghanistanAfricaAlbaniaArgentinaArmeniaAsiaAustraliaAustriaBahamasBangladeshBarbadosBelarusBelgiumBelizeBoliviaBosnia and HerzegovinaBrazilBulgariaBurma/MyanmarCabo VerdeCambodiaCameroonCanadaCaribbeanCentral AmericaChileChinaColombiaCongoCosta RicaCroatiaCubaCzechoslovakiaDenmarkDominicaDominican RepublicEastern AfricaEastern AsiaEastern EuropeEcuadorEgyptEl SalvadorEnglandEritreaEthiopiaEuropeFijiFranceGermanyGhanaGreeceGrenadaGuatemalaGuyanaHaitiHondurasHong KongHungaryIndiaIndonesiaIranIraqIrelandIsraelItalyJamaicaJapanJordanKazakhstanKenyaKoreaKuwaitLaosLatin AmericaLatviaLebanonLiberiaLithuaniaMalaysiaMexicoMicronesiaMiddle AfricaMoldovaMoroccoNepalNetherlandsNicaraguaNigeriaNorth AmericaNorth MacedoniaNorthern AfricaNorthern EuropeNorwayOceaniaPakistanPanamaPeruPhilippinesPolandPortugalRomaniaRussiaSaudi ArabiaScotlandSenegalSerbiaSierra LeoneSingaporeSomaliaSouth AfricaSouth AmericaSouth Central AsiaSouth Eastern AsiaSouthern EuropeSpainSri LankaSt. Vincent and the GrenadinesSudanSwedenSwitzerlandSyriaTaiwanThailandTrinidad and TobagoTurkeyUgandaUkraineUruguayUzbekistanVenezuelaVietnamWest IndiesWestern AfricaWestern AsiaWestern EuropeYemenZaireZimbabweAzores
12th Grade, No Diploma
Income
Poverty
Unemployment
Labor Participation
Family Structure
Vehicle Availability
Education Level
Disability

12th Grade, No Diploma Comparison

Arabs

Immigrants from Ireland

Excellent
Exceptional
91.6%
12TH GRADE, NO DIPLOMA
84.1/ 100
METRIC RATING
138th/ 347
METRIC RANK
93.1%
12TH GRADE, NO DIPLOMA
99.9/ 100
METRIC RATING
31st/ 347
METRIC RANK

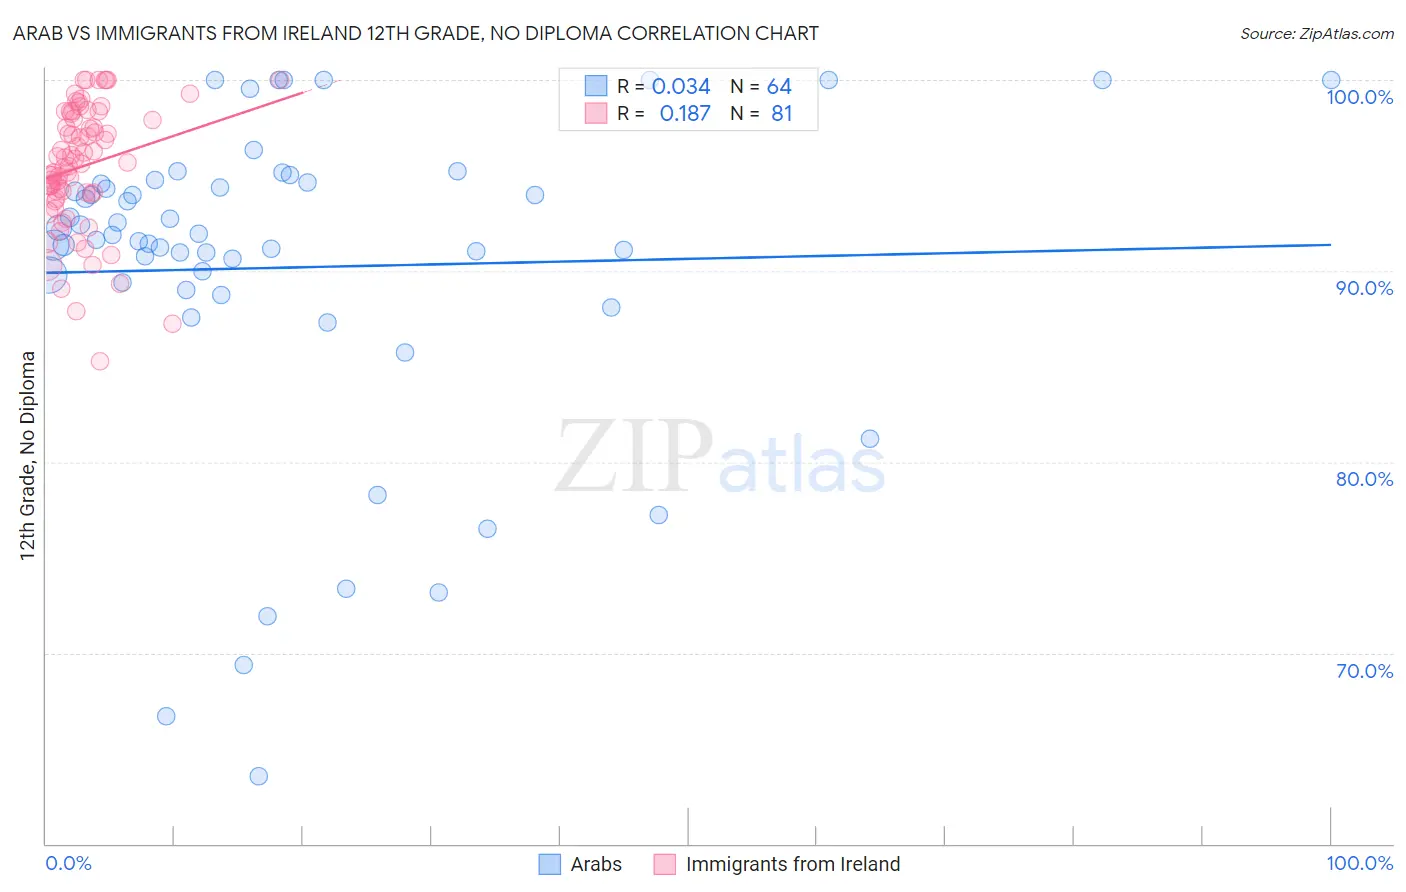
Arab vs Immigrants from Ireland 12th Grade, No Diploma Correlation Chart

The statistical analysis conducted on geographies consisting of 486,870,847 people shows no correlation between the proportion of Arabs and percentage of population with at least 12th grade (no diploma) education in the United States with a correlation coefficient (R) of 0.034 and weighted average of 91.6%. Similarly, the statistical analysis conducted on geographies consisting of 240,784,498 people shows a poor positive correlation between the proportion of Immigrants from Ireland and percentage of population with at least 12th grade (no diploma) education in the United States with a correlation coefficient (R) of 0.187 and weighted average of 93.1%, a difference of 1.6%.
Arab vs Immigrants from Ireland 12th Grade, No Diploma

12th Grade, No Diploma Correlation Summary

MeasurementArabImmigrants from Ireland
Minimum63.5%85.3%
Maximum100.0%100.0%
Range36.5%14.7%
Mean90.2%95.5%
Median91.8%95.7%
Interquartile 25% (IQ1)89.2%94.1%
Interquartile 75% (IQ3)94.6%98.1%
Interquartile Range (IQR)5.4%4.0%
Standard Deviation (Sample)8.4%3.2%
Standard Deviation (Population)8.3%3.2%

Similar Demographics by 12th Grade, No Diploma

Demographics Similar to Arabs by 12th Grade, No Diploma

In terms of 12th grade, no diploma, the demographic groups most similar to Arabs are Immigrants from Egypt (91.6%, a difference of 0.0%), Alaska Native (91.6%, a difference of 0.020%), Chilean (91.7%, a difference of 0.040%), Immigrants from Poland (91.6%, a difference of 0.040%), and Argentinean (91.6%, a difference of 0.050%).
DemographicsRating | Rank12th Grade, No Diploma
Albanians
89.3
/100
|
#131
Excellent
91.8%
Immigrants | Eastern Asia
89.3
/100
|
#132
Excellent
91.8%
Immigrants | Italy
88.3
/100
|
#133
Excellent
91.7%
Venezuelans
88.2
/100
|
#134
Excellent
91.7%
Immigrants | Bosnia and Herzegovina
87.3
/100
|
#135
Excellent
91.7%
Chileans
85.8
/100
|
#136
Excellent
91.7%
Alaska Natives
84.9
/100
|
#137
Excellent
91.6%
Arabs
84.1
/100
|
#138
Excellent
91.6%
Immigrants | Egypt
83.9
/100
|
#139
Excellent
91.6%
Immigrants | Poland
82.3
/100
|
#140
Excellent
91.6%
Argentineans
82.0
/100
|
#141
Excellent
91.6%
Immigrants | Venezuela
80.9
/100
|
#142
Excellent
91.6%
Immigrants | Argentina
80.7
/100
|
#143
Excellent
91.6%
Immigrants | Spain
80.1
/100
|
#144
Excellent
91.6%
Immigrants | Lebanon
80.0
/100
|
#145
Excellent
91.6%

Demographics Similar to Immigrants from Ireland by 12th Grade, No Diploma

In terms of 12th grade, no diploma, the demographic groups most similar to Immigrants from Ireland are European (93.1%, a difference of 0.010%), Iranian (93.1%, a difference of 0.020%), Immigrants from Lithuania (93.1%, a difference of 0.020%), Immigrants from Northern Europe (93.1%, a difference of 0.030%), and Immigrants from Scotland (93.0%, a difference of 0.050%).
DemographicsRating | Rank12th Grade, No Diploma
Thais
99.9
/100
|
#24
Exceptional
93.2%
Czechs
99.9
/100
|
#25
Exceptional
93.2%
Russians
99.9
/100
|
#26
Exceptional
93.2%
Cypriots
99.9
/100
|
#27
Exceptional
93.1%
Immigrants | Northern Europe
99.9
/100
|
#28
Exceptional
93.1%
Iranians
99.9
/100
|
#29
Exceptional
93.1%
Immigrants | Lithuania
99.9
/100
|
#30
Exceptional
93.1%
Immigrants | Ireland
99.9
/100
|
#31
Exceptional
93.1%
Europeans
99.9
/100
|
#32
Exceptional
93.1%
Immigrants | Scotland
99.9
/100
|
#33
Exceptional
93.0%
Okinawans
99.9
/100
|
#34
Exceptional
93.0%
English
99.9
/100
|
#35
Exceptional
93.0%
Scottish
99.9
/100
|
#36
Exceptional
93.0%
Irish
99.9
/100
|
#37
Exceptional
93.0%
Tlingit-Haida
99.8
/100
|
#38
Exceptional
93.0%