Apache vs Belizean College, Under 1 year
COMPARE
Apache
Belizean
College, Under 1 year
College, Under 1 year Comparison
Apache
Belizeans
58.0%
COLLEGE, UNDER 1 YEAR
0.0/ 100
METRIC RATING
302nd/ 347
METRIC RANK
60.1%
COLLEGE, UNDER 1 YEAR
0.1/ 100
METRIC RATING
282nd/ 347
METRIC RANK
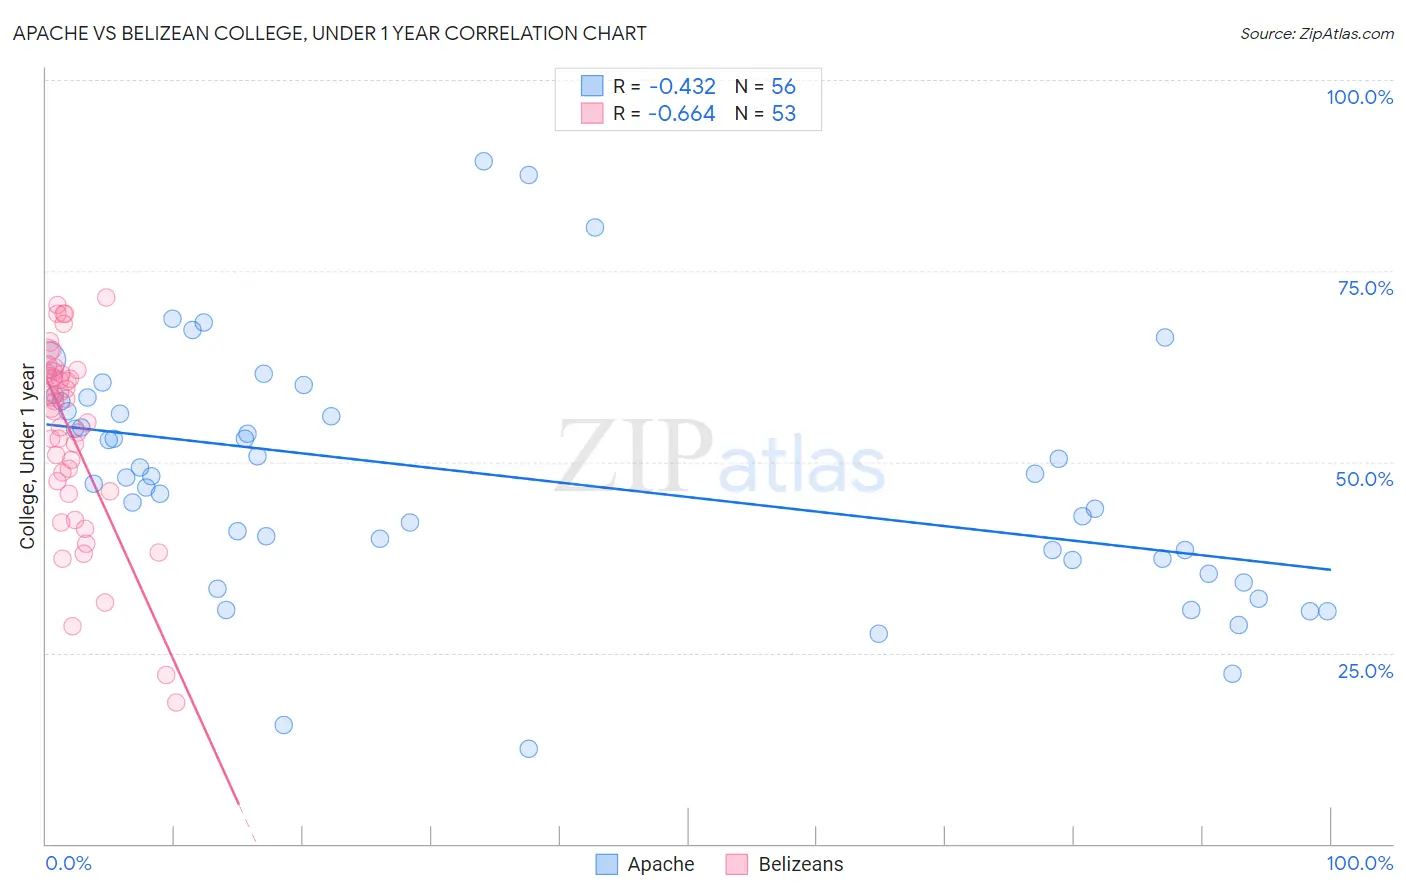
Apache vs Belizean College, Under 1 year Correlation Chart
The statistical analysis conducted on geographies consisting of 231,142,948 people shows a moderate negative correlation between the proportion of Apache and percentage of population with at least college, under 1 year education in the United States with a correlation coefficient (R) of -0.432 and weighted average of 58.0%. Similarly, the statistical analysis conducted on geographies consisting of 144,224,111 people shows a significant negative correlation between the proportion of Belizeans and percentage of population with at least college, under 1 year education in the United States with a correlation coefficient (R) of -0.664 and weighted average of 60.1%, a difference of 3.5%.
College, Under 1 year Correlation Summary
| Measurement | Apache | Belizean |
| Minimum | 12.5% | 18.5% |
| Maximum | 89.3% | 71.6% |
| Range | 76.8% | 53.1% |
| Mean | 47.9% | 53.9% |
| Median | 48.0% | 58.0% |
| Interquartile 25% (IQ1) | 37.3% | 46.8% |
| Interquartile 75% (IQ3) | 57.3% | 61.7% |
| Interquartile Range (IQR) | 20.1% | 14.9% |
| Standard Deviation (Sample) | 15.9% | 12.2% |
| Standard Deviation (Population) | 15.7% | 12.1% |
Demographics Similar to Apache and Belizeans by College, Under 1 year
In terms of college, under 1 year, the demographic groups most similar to Apache are Mexican American Indian (58.1%, a difference of 0.19%), Immigrants from Guyana (58.5%, a difference of 0.81%), Cuban (58.6%, a difference of 1.1%), Immigrants from Ecuador (58.7%, a difference of 1.2%), and Guyanese (59.0%, a difference of 1.7%). Similarly, the demographic groups most similar to Belizeans are Immigrants from Jamaica (59.7%, a difference of 0.63%), Immigrants from St. Vincent and the Grenadines (59.6%, a difference of 0.75%), Paiute (59.6%, a difference of 0.76%), British West Indian (59.5%, a difference of 0.90%), and Sioux (59.4%, a difference of 1.1%).
| Demographics | Rating | Rank | College, Under 1 year |
| Belizeans | 0.1 /100 | #282 | Tragic 60.1% |
| Immigrants | Jamaica | 0.0 /100 | #283 | Tragic 59.7% |
| Immigrants | St. Vincent and the Grenadines | 0.0 /100 | #284 | Tragic 59.6% |
| Paiute | 0.0 /100 | #285 | Tragic 59.6% |
| British West Indians | 0.0 /100 | #286 | Tragic 59.5% |
| Sioux | 0.0 /100 | #287 | Tragic 59.4% |
| Blacks/African Americans | 0.0 /100 | #288 | Tragic 59.4% |
| Choctaw | 0.0 /100 | #289 | Tragic 59.3% |
| Ecuadorians | 0.0 /100 | #290 | Tragic 59.3% |
| Creek | 0.0 /100 | #291 | Tragic 59.3% |
| Nicaraguans | 0.0 /100 | #292 | Tragic 59.2% |
| Seminole | 0.0 /100 | #293 | Tragic 59.1% |
| Immigrants | Belize | 0.0 /100 | #294 | Tragic 59.1% |
| Immigrants | Grenada | 0.0 /100 | #295 | Tragic 59.1% |
| Central American Indians | 0.0 /100 | #296 | Tragic 59.0% |
| Guyanese | 0.0 /100 | #297 | Tragic 59.0% |
| Immigrants | Ecuador | 0.0 /100 | #298 | Tragic 58.7% |
| Cubans | 0.0 /100 | #299 | Tragic 58.6% |
| Immigrants | Guyana | 0.0 /100 | #300 | Tragic 58.5% |
| Mexican American Indians | 0.0 /100 | #301 | Tragic 58.1% |
| Apache | 0.0 /100 | #302 | Tragic 58.0% |