American vs Immigrants from Germany Kindergarten
COMPARE
American
Immigrants from Germany
Kindergarten
Kindergarten Comparison
Americans
Immigrants from Germany
98.4%
KINDERGARTEN
99.8/ 100
METRIC RATING
56th/ 347
METRIC RANK
98.3%
KINDERGARTEN
98.5/ 100
METRIC RATING
95th/ 347
METRIC RANK
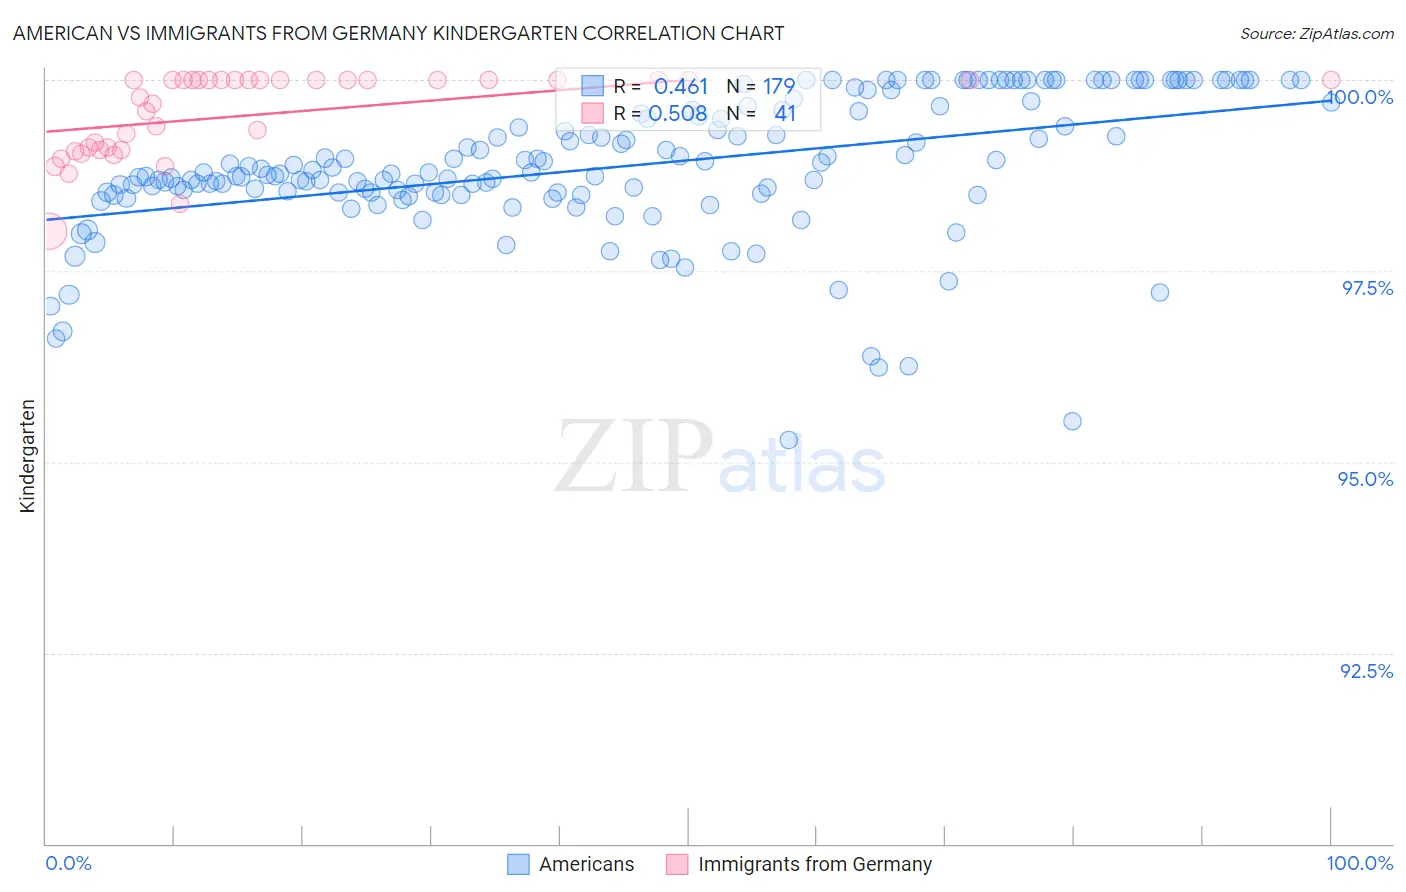
American vs Immigrants from Germany Kindergarten Correlation Chart
The statistical analysis conducted on geographies consisting of 581,990,776 people shows a moderate positive correlation between the proportion of Americans and percentage of population with at least kindergarten education in the United States with a correlation coefficient (R) of 0.461 and weighted average of 98.4%. Similarly, the statistical analysis conducted on geographies consisting of 463,886,643 people shows a substantial positive correlation between the proportion of Immigrants from Germany and percentage of population with at least kindergarten education in the United States with a correlation coefficient (R) of 0.508 and weighted average of 98.3%, a difference of 0.14%.
Kindergarten Correlation Summary
| Measurement | American | Immigrants from Germany |
| Minimum | 95.3% | 98.0% |
| Maximum | 100.0% | 100.0% |
| Range | 4.7% | 2.0% |
| Mean | 98.9% | 99.6% |
| Median | 98.8% | 100.0% |
| Interquartile 25% (IQ1) | 98.5% | 99.1% |
| Interquartile 75% (IQ3) | 99.7% | 100.0% |
| Interquartile Range (IQR) | 1.1% | 0.91% |
| Standard Deviation (Sample) | 0.91% | 0.54% |
| Standard Deviation (Population) | 0.91% | 0.53% |
Similar Demographics by Kindergarten
Demographics Similar to Americans by Kindergarten
In terms of kindergarten, the demographic groups most similar to Americans are Austrian (98.4%, a difference of 0.0%), Bulgarian (98.4%, a difference of 0.0%), Immigrants from Scotland (98.4%, a difference of 0.010%), Immigrants from Canada (98.4%, a difference of 0.010%), and Creek (98.4%, a difference of 0.010%).
| Demographics | Rating | Rank | Kindergarten |
| Kiowa | 99.8 /100 | #49 | Exceptional 98.4% |
| Whites/Caucasians | 99.8 /100 | #50 | Exceptional 98.4% |
| Estonians | 99.8 /100 | #51 | Exceptional 98.4% |
| Australians | 99.8 /100 | #52 | Exceptional 98.4% |
| Celtics | 99.8 /100 | #53 | Exceptional 98.4% |
| Pueblo | 99.8 /100 | #54 | Exceptional 98.4% |
| Immigrants | Scotland | 99.8 /100 | #55 | Exceptional 98.4% |
| Americans | 99.8 /100 | #56 | Exceptional 98.4% |
| Austrians | 99.8 /100 | #57 | Exceptional 98.4% |
| Bulgarians | 99.7 /100 | #58 | Exceptional 98.4% |
| Immigrants | Canada | 99.7 /100 | #59 | Exceptional 98.4% |
| Creek | 99.7 /100 | #60 | Exceptional 98.4% |
| Slavs | 99.7 /100 | #61 | Exceptional 98.4% |
| New Zealanders | 99.7 /100 | #62 | Exceptional 98.4% |
| Immigrants | North America | 99.7 /100 | #63 | Exceptional 98.4% |
Demographics Similar to Immigrants from Germany by Kindergarten
In terms of kindergarten, the demographic groups most similar to Immigrants from Germany are South African (98.3%, a difference of 0.0%), Zimbabwean (98.3%, a difference of 0.010%), Immigrants from Western Europe (98.3%, a difference of 0.010%), Macedonian (98.3%, a difference of 0.010%), and Immigrants from India (98.3%, a difference of 0.010%).
| Demographics | Rating | Rank | Kindergarten |
| Ukrainians | 98.8 /100 | #88 | Exceptional 98.3% |
| Immigrants | South Africa | 98.8 /100 | #89 | Exceptional 98.3% |
| Zimbabweans | 98.8 /100 | #90 | Exceptional 98.3% |
| Immigrants | Western Europe | 98.8 /100 | #91 | Exceptional 98.3% |
| Macedonians | 98.7 /100 | #92 | Exceptional 98.3% |
| Immigrants | India | 98.6 /100 | #93 | Exceptional 98.3% |
| South Africans | 98.5 /100 | #94 | Exceptional 98.3% |
| Immigrants | Germany | 98.5 /100 | #95 | Exceptional 98.3% |
| Immigrants | Nonimmigrants | 98.3 /100 | #96 | Exceptional 98.3% |
| Cypriots | 98.3 /100 | #97 | Exceptional 98.3% |
| Choctaw | 98.2 /100 | #98 | Exceptional 98.3% |
| Colville | 98.2 /100 | #99 | Exceptional 98.3% |
| Puget Sound Salish | 98.1 /100 | #100 | Exceptional 98.2% |
| Romanians | 97.8 /100 | #101 | Exceptional 98.2% |
| Cree | 97.7 /100 | #102 | Exceptional 98.2% |