Alsatian vs Immigrants from Oceania 11th Grade
COMPARE
Alsatian
Immigrants from Oceania
11th Grade
11th Grade Comparison
Alsatians
Immigrants from Oceania
92.6%
11TH GRADE
60.2/ 100
METRIC RATING
167th/ 347
METRIC RANK
92.2%
11TH GRADE
22.4/ 100
METRIC RATING
207th/ 347
METRIC RANK
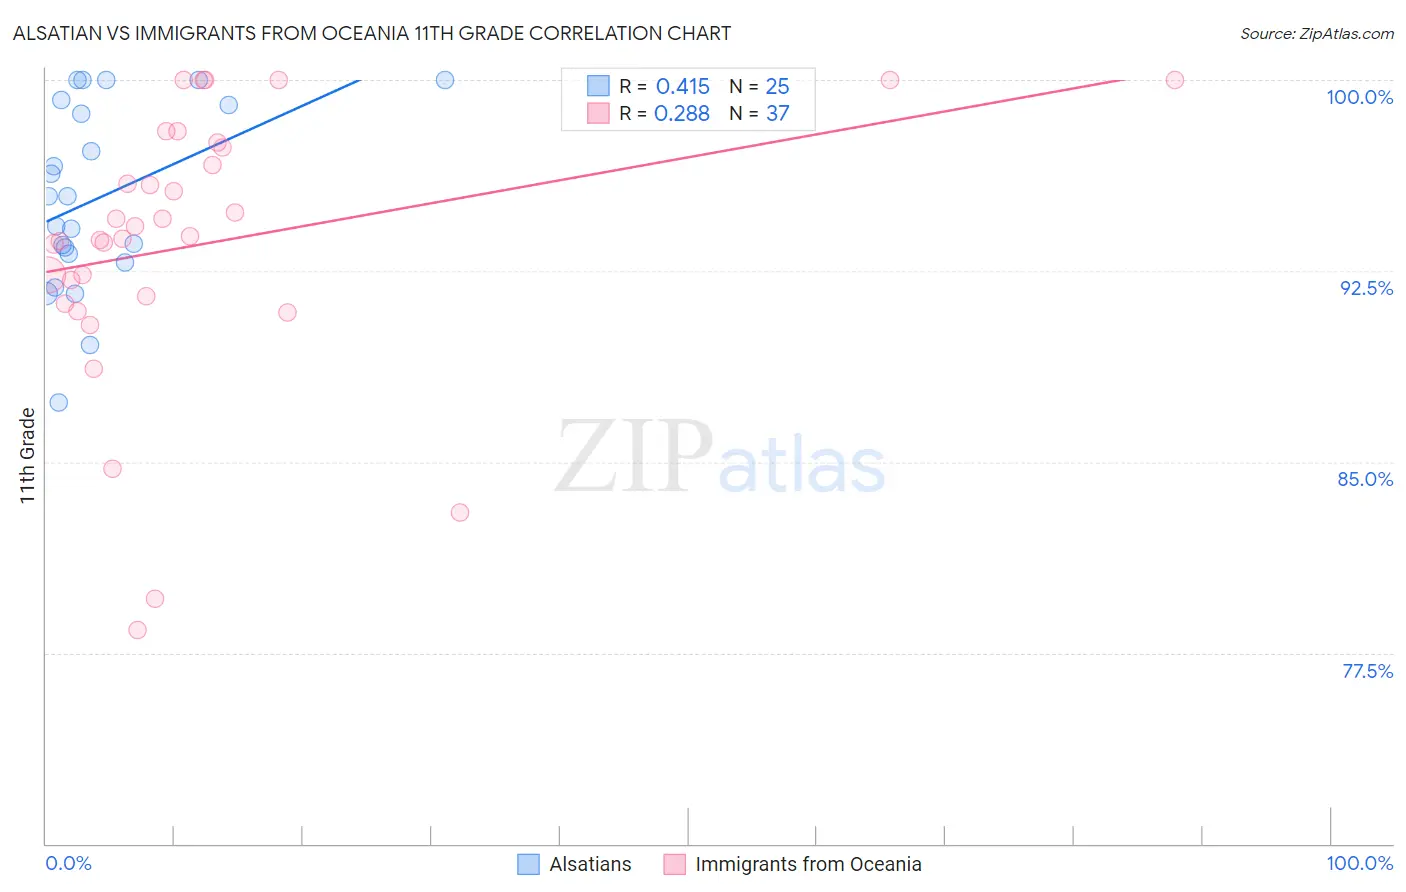
Alsatian vs Immigrants from Oceania 11th Grade Correlation Chart
The statistical analysis conducted on geographies consisting of 82,682,365 people shows a moderate positive correlation between the proportion of Alsatians and percentage of population with at least 11th grade education in the United States with a correlation coefficient (R) of 0.415 and weighted average of 92.6%. Similarly, the statistical analysis conducted on geographies consisting of 305,521,521 people shows a weak positive correlation between the proportion of Immigrants from Oceania and percentage of population with at least 11th grade education in the United States with a correlation coefficient (R) of 0.288 and weighted average of 92.2%, a difference of 0.41%.
11th Grade Correlation Summary
| Measurement | Alsatian | Immigrants from Oceania |
| Minimum | 87.3% | 78.4% |
| Maximum | 100.0% | 100.0% |
| Range | 12.7% | 21.6% |
| Mean | 95.4% | 93.6% |
| Median | 95.4% | 93.8% |
| Interquartile 25% (IQ1) | 93.0% | 91.4% |
| Interquartile 75% (IQ3) | 99.1% | 97.5% |
| Interquartile Range (IQR) | 6.1% | 6.1% |
| Standard Deviation (Sample) | 3.6% | 5.3% |
| Standard Deviation (Population) | 3.6% | 5.3% |
Similar Demographics by 11th Grade
Demographics Similar to Alsatians by 11th Grade
In terms of 11th grade, the demographic groups most similar to Alsatians are Bermudan (92.6%, a difference of 0.020%), Sierra Leonean (92.6%, a difference of 0.020%), Immigrants from Albania (92.6%, a difference of 0.020%), Immigrants from Northern Africa (92.6%, a difference of 0.030%), and Immigrants from Iraq (92.6%, a difference of 0.040%).
| Demographics | Rating | Rank | 11th Grade |
| Immigrants | Lebanon | 70.7 /100 | #160 | Good 92.7% |
| Immigrants | Argentina | 69.8 /100 | #161 | Good 92.7% |
| Paraguayans | 68.7 /100 | #162 | Good 92.7% |
| Immigrants | Nonimmigrants | 66.6 /100 | #163 | Good 92.7% |
| Spanish | 66.2 /100 | #164 | Good 92.7% |
| Immigrants | Iraq | 63.7 /100 | #165 | Good 92.6% |
| Bermudans | 62.3 /100 | #166 | Good 92.6% |
| Alsatians | 60.2 /100 | #167 | Good 92.6% |
| Sierra Leoneans | 58.7 /100 | #168 | Average 92.6% |
| Immigrants | Albania | 57.8 /100 | #169 | Average 92.6% |
| Immigrants | Northern Africa | 57.3 /100 | #170 | Average 92.6% |
| Laotians | 54.4 /100 | #171 | Average 92.6% |
| Immigrants | Pakistan | 52.3 /100 | #172 | Average 92.5% |
| Indians (Asian) | 51.5 /100 | #173 | Average 92.5% |
| Asians | 50.0 /100 | #174 | Average 92.5% |
Demographics Similar to Immigrants from Oceania by 11th Grade
In terms of 11th grade, the demographic groups most similar to Immigrants from Oceania are Immigrants from Sudan (92.3%, a difference of 0.010%), Immigrants from Hong Kong (92.2%, a difference of 0.010%), Kiowa (92.2%, a difference of 0.010%), Bolivian (92.2%, a difference of 0.010%), and Colville (92.2%, a difference of 0.010%).
| Demographics | Rating | Rank | 11th Grade |
| Samoans | 25.1 /100 | #200 | Fair 92.3% |
| Immigrants | China | 25.1 /100 | #201 | Fair 92.3% |
| Immigrants | Eastern Africa | 24.1 /100 | #202 | Fair 92.3% |
| Immigrants | Sudan | 23.5 /100 | #203 | Fair 92.3% |
| Immigrants | Hong Kong | 23.3 /100 | #204 | Fair 92.2% |
| Kiowa | 23.2 /100 | #205 | Fair 92.2% |
| Bolivians | 23.2 /100 | #206 | Fair 92.2% |
| Immigrants | Oceania | 22.4 /100 | #207 | Fair 92.2% |
| Colville | 21.8 /100 | #208 | Fair 92.2% |
| Tongans | 19.8 /100 | #209 | Poor 92.2% |
| Ethiopians | 18.8 /100 | #210 | Poor 92.2% |
| Immigrants | Micronesia | 17.7 /100 | #211 | Poor 92.2% |
| Koreans | 14.4 /100 | #212 | Poor 92.1% |
| Immigrants | Ethiopia | 13.9 /100 | #213 | Poor 92.1% |
| Afghans | 12.8 /100 | #214 | Poor 92.1% |