Alsatian vs Guatemalan 10th Grade
COMPARE
Alsatian
Guatemalan
10th Grade
10th Grade Comparison
Alsatians
Guatemalans
93.8%
10TH GRADE
59.4/ 100
METRIC RATING
168th/ 347
METRIC RANK
87.9%
10TH GRADE
0.0/ 100
METRIC RATING
339th/ 347
METRIC RANK
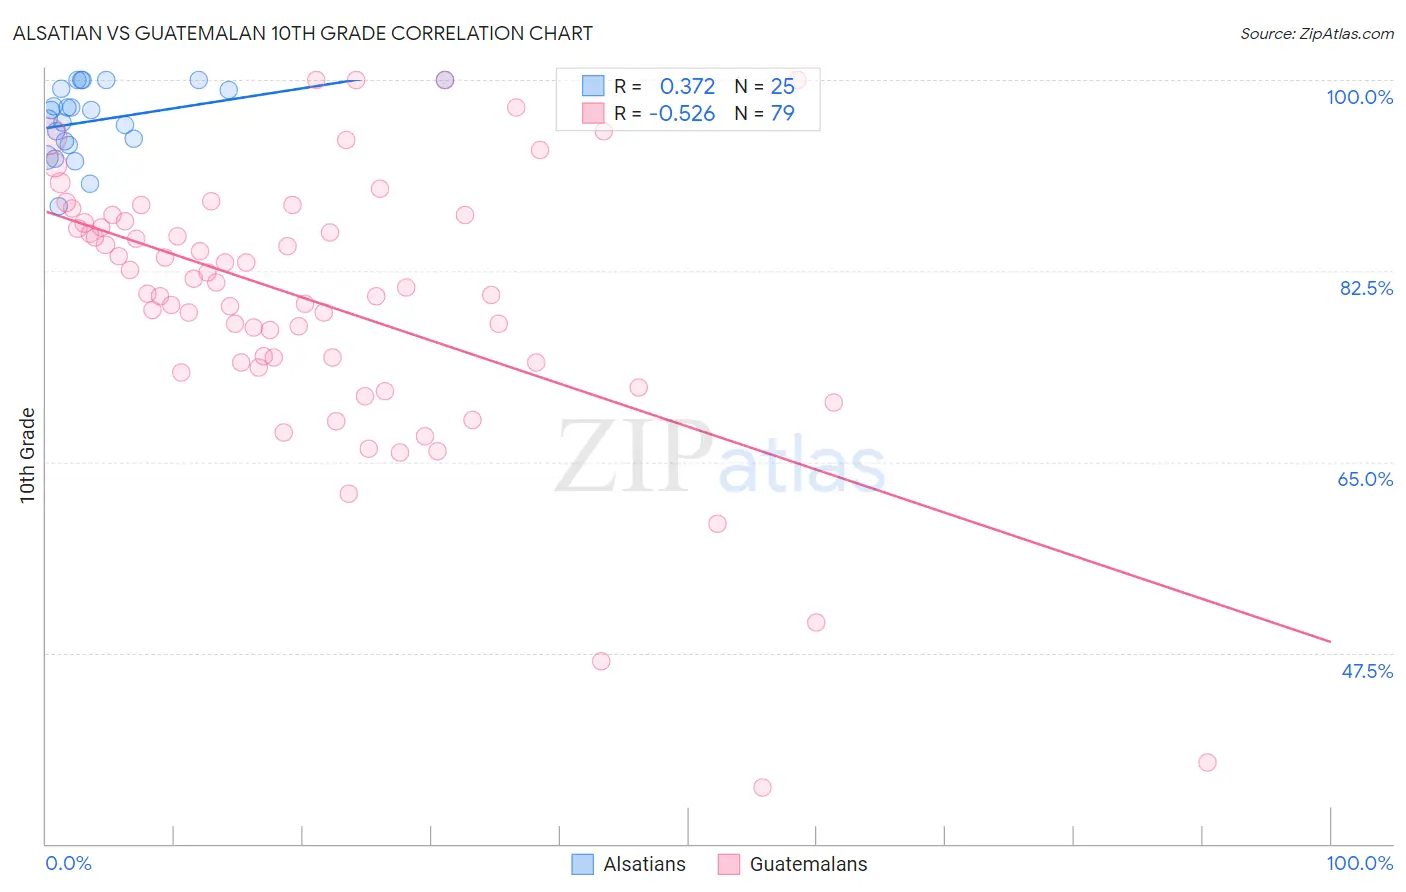
Alsatian vs Guatemalan 10th Grade Correlation Chart
The statistical analysis conducted on geographies consisting of 82,682,365 people shows a mild positive correlation between the proportion of Alsatians and percentage of population with at least 10th grade education in the United States with a correlation coefficient (R) of 0.372 and weighted average of 93.8%. Similarly, the statistical analysis conducted on geographies consisting of 409,566,618 people shows a substantial negative correlation between the proportion of Guatemalans and percentage of population with at least 10th grade education in the United States with a correlation coefficient (R) of -0.526 and weighted average of 87.9%, a difference of 6.7%.
10th Grade Correlation Summary
| Measurement | Alsatian | Guatemalan |
| Minimum | 88.4% | 35.2% |
| Maximum | 100.0% | 100.0% |
| Range | 11.6% | 64.8% |
| Mean | 96.4% | 79.6% |
| Median | 97.2% | 81.0% |
| Interquartile 25% (IQ1) | 94.2% | 74.1% |
| Interquartile 75% (IQ3) | 99.6% | 87.0% |
| Interquartile Range (IQR) | 5.4% | 12.9% |
| Standard Deviation (Sample) | 3.2% | 12.6% |
| Standard Deviation (Population) | 3.2% | 12.5% |
Similar Demographics by 10th Grade
Demographics Similar to Alsatians by 10th Grade
In terms of 10th grade, the demographic groups most similar to Alsatians are Immigrants from Iraq (93.8%, a difference of 0.030%), Immigrants from Egypt (93.8%, a difference of 0.030%), Immigrants from Spain (93.8%, a difference of 0.030%), Brazilian (93.8%, a difference of 0.040%), and Immigrants from Venezuela (93.8%, a difference of 0.050%).
| Demographics | Rating | Rank | 10th Grade |
| Assyrians/Chaldeans/Syriacs | 69.7 /100 | #161 | Good 93.9% |
| Immigrants | Poland | 69.6 /100 | #162 | Good 93.9% |
| Venezuelans | 69.5 /100 | #163 | Good 93.9% |
| Iraqis | 68.1 /100 | #164 | Good 93.9% |
| Brazilians | 63.6 /100 | #165 | Good 93.8% |
| Immigrants | Iraq | 63.0 /100 | #166 | Good 93.8% |
| Immigrants | Egypt | 62.3 /100 | #167 | Good 93.8% |
| Alsatians | 59.4 /100 | #168 | Average 93.8% |
| Immigrants | Spain | 55.9 /100 | #169 | Average 93.8% |
| Immigrants | Venezuela | 53.9 /100 | #170 | Average 93.8% |
| Immigrants | Albania | 52.4 /100 | #171 | Average 93.8% |
| French American Indians | 50.9 /100 | #172 | Average 93.7% |
| Spaniards | 50.3 /100 | #173 | Average 93.7% |
| Argentineans | 50.0 /100 | #174 | Average 93.7% |
| Immigrants | Nepal | 49.6 /100 | #175 | Average 93.7% |
Demographics Similar to Guatemalans by 10th Grade
In terms of 10th grade, the demographic groups most similar to Guatemalans are Mexican (87.8%, a difference of 0.16%), Salvadoran (87.5%, a difference of 0.44%), Immigrants from Latin America (88.3%, a difference of 0.49%), Central American (88.4%, a difference of 0.56%), and Immigrants from Guatemala (87.4%, a difference of 0.60%).
| Demographics | Rating | Rank | 10th Grade |
| Immigrants | Azores | 0.0 /100 | #332 | Tragic 89.0% |
| Hondurans | 0.0 /100 | #333 | Tragic 89.0% |
| Hispanics or Latinos | 0.0 /100 | #334 | Tragic 88.9% |
| Immigrants | Dominican Republic | 0.0 /100 | #335 | Tragic 88.7% |
| Immigrants | Honduras | 0.0 /100 | #336 | Tragic 88.5% |
| Central Americans | 0.0 /100 | #337 | Tragic 88.4% |
| Immigrants | Latin America | 0.0 /100 | #338 | Tragic 88.3% |
| Guatemalans | 0.0 /100 | #339 | Tragic 87.9% |
| Mexicans | 0.0 /100 | #340 | Tragic 87.8% |
| Salvadorans | 0.0 /100 | #341 | Tragic 87.5% |
| Immigrants | Guatemala | 0.0 /100 | #342 | Tragic 87.4% |
| Yakama | 0.0 /100 | #343 | Tragic 86.9% |
| Immigrants | El Salvador | 0.0 /100 | #344 | Tragic 86.8% |
| Immigrants | Central America | 0.0 /100 | #345 | Tragic 86.6% |
| Spanish American Indians | 0.0 /100 | #346 | Tragic 86.2% |