Aleut vs Immigrants from Australia Doctorate Degree
COMPARE
Aleut
Immigrants from Australia
Doctorate Degree
Doctorate Degree Comparison
Aleuts
Immigrants from Australia
1.5%
DOCTORATE DEGREE
0.4/ 100
METRIC RATING
275th/ 347
METRIC RANK
2.8%
DOCTORATE DEGREE
100.0/ 100
METRIC RATING
17th/ 347
METRIC RANK
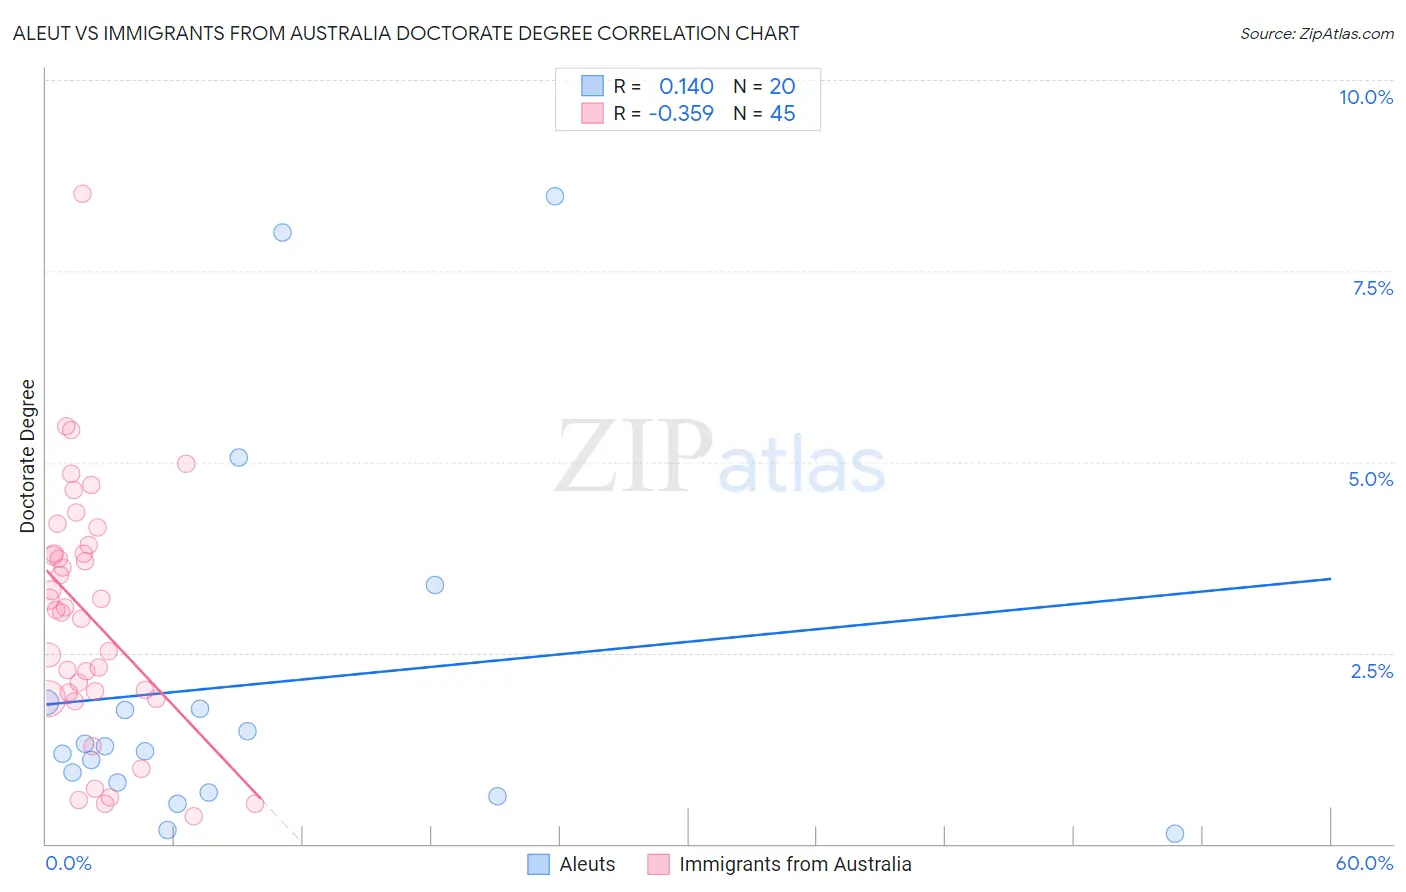
Aleut vs Immigrants from Australia Doctorate Degree Correlation Chart
The statistical analysis conducted on geographies consisting of 61,540,256 people shows a poor positive correlation between the proportion of Aleuts and percentage of population with at least doctorate degree education in the United States with a correlation coefficient (R) of 0.140 and weighted average of 1.5%. Similarly, the statistical analysis conducted on geographies consisting of 226,352,894 people shows a mild negative correlation between the proportion of Immigrants from Australia and percentage of population with at least doctorate degree education in the United States with a correlation coefficient (R) of -0.359 and weighted average of 2.8%, a difference of 90.4%.
Doctorate Degree Correlation Summary
| Measurement | Aleut | Immigrants from Australia |
| Minimum | 0.13% | 0.36% |
| Maximum | 8.5% | 8.5% |
| Range | 8.3% | 8.2% |
| Mean | 2.1% | 3.0% |
| Median | 1.2% | 3.1% |
| Interquartile 25% (IQ1) | 0.74% | 1.9% |
| Interquartile 75% (IQ3) | 1.8% | 3.9% |
| Interquartile Range (IQR) | 1.1% | 1.9% |
| Standard Deviation (Sample) | 2.4% | 1.6% |
| Standard Deviation (Population) | 2.3% | 1.6% |
Similar Demographics by Doctorate Degree
Demographics Similar to Aleuts by Doctorate Degree
In terms of doctorate degree, the demographic groups most similar to Aleuts are Paiute (1.5%, a difference of 0.050%), Yaqui (1.5%, a difference of 0.12%), Sioux (1.5%, a difference of 0.14%), Immigrants from Barbados (1.5%, a difference of 0.25%), and Immigrants from Trinidad and Tobago (1.5%, a difference of 0.34%).
| Demographics | Rating | Rank | Doctorate Degree |
| U.S. Virgin Islanders | 0.5 /100 | #268 | Tragic 1.5% |
| Crow | 0.5 /100 | #269 | Tragic 1.5% |
| Salvadorans | 0.5 /100 | #270 | Tragic 1.5% |
| Immigrants | Trinidad and Tobago | 0.5 /100 | #271 | Tragic 1.5% |
| Immigrants | Barbados | 0.4 /100 | #272 | Tragic 1.5% |
| Sioux | 0.4 /100 | #273 | Tragic 1.5% |
| Yaqui | 0.4 /100 | #274 | Tragic 1.5% |
| Aleuts | 0.4 /100 | #275 | Tragic 1.5% |
| Paiute | 0.4 /100 | #276 | Tragic 1.5% |
| Bahamians | 0.4 /100 | #277 | Tragic 1.5% |
| Hawaiians | 0.4 /100 | #278 | Tragic 1.5% |
| Marshallese | 0.4 /100 | #279 | Tragic 1.5% |
| Ecuadorians | 0.4 /100 | #280 | Tragic 1.5% |
| Tohono O'odham | 0.4 /100 | #281 | Tragic 1.5% |
| British West Indians | 0.3 /100 | #282 | Tragic 1.5% |
Demographics Similar to Immigrants from Australia by Doctorate Degree
In terms of doctorate degree, the demographic groups most similar to Immigrants from Australia are Immigrants from Sri Lanka (2.8%, a difference of 0.24%), Immigrants from Japan (2.8%, a difference of 0.62%), Eastern European (2.8%, a difference of 0.70%), Immigrants from Hong Kong (2.8%, a difference of 0.97%), and Immigrants from India (2.8%, a difference of 1.0%).
| Demographics | Rating | Rank | Doctorate Degree |
| Immigrants | Eastern Asia | 100.0 /100 | #10 | Exceptional 3.0% |
| Indians (Asian) | 100.0 /100 | #11 | Exceptional 2.9% |
| Immigrants | Belgium | 100.0 /100 | #12 | Exceptional 2.9% |
| Immigrants | Sweden | 100.0 /100 | #13 | Exceptional 2.9% |
| Immigrants | France | 100.0 /100 | #14 | Exceptional 2.9% |
| Immigrants | India | 100.0 /100 | #15 | Exceptional 2.8% |
| Eastern Europeans | 100.0 /100 | #16 | Exceptional 2.8% |
| Immigrants | Australia | 100.0 /100 | #17 | Exceptional 2.8% |
| Immigrants | Sri Lanka | 100.0 /100 | #18 | Exceptional 2.8% |
| Immigrants | Japan | 100.0 /100 | #19 | Exceptional 2.8% |
| Immigrants | Hong Kong | 100.0 /100 | #20 | Exceptional 2.8% |
| Thais | 100.0 /100 | #21 | Exceptional 2.8% |
| Mongolians | 100.0 /100 | #22 | Exceptional 2.8% |
| Immigrants | Denmark | 100.0 /100 | #23 | Exceptional 2.8% |
| Israelis | 100.0 /100 | #24 | Exceptional 2.7% |