Albanian vs Luxembourger Bachelor's Degree
COMPARE
Albanian
Luxembourger
Bachelor's Degree
Bachelor's Degree Comparison
Albanians
Luxembourgers
40.9%
BACHELOR'S DEGREE
96.5/ 100
METRIC RATING
110th/ 347
METRIC RANK
39.8%
BACHELOR'S DEGREE
89.1/ 100
METRIC RATING
135th/ 347
METRIC RANK
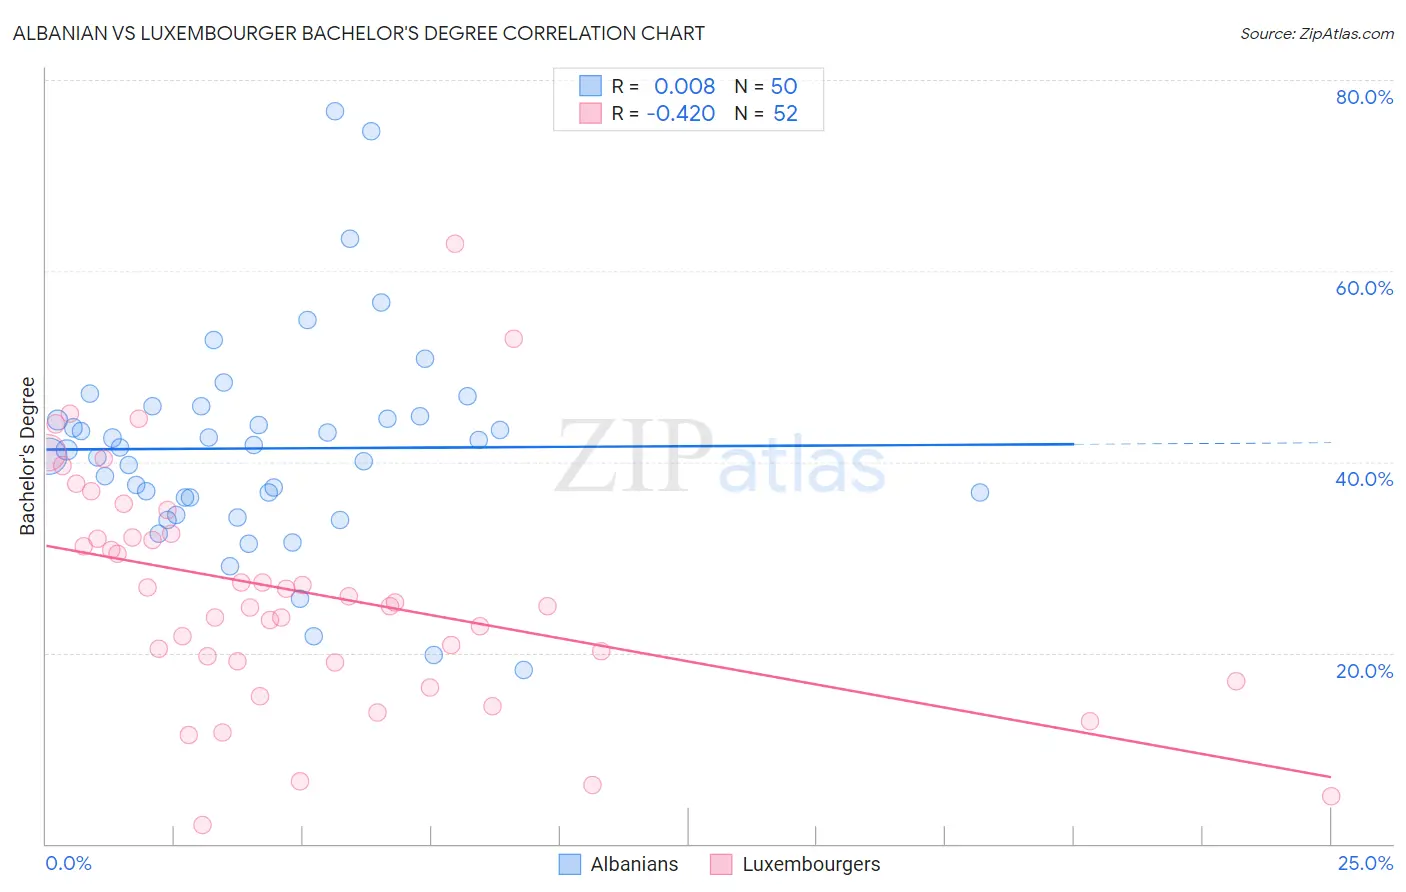
Albanian vs Luxembourger Bachelor's Degree Correlation Chart
The statistical analysis conducted on geographies consisting of 193,245,507 people shows no correlation between the proportion of Albanians and percentage of population with at least bachelor's degree education in the United States with a correlation coefficient (R) of 0.008 and weighted average of 40.9%. Similarly, the statistical analysis conducted on geographies consisting of 144,665,443 people shows a moderate negative correlation between the proportion of Luxembourgers and percentage of population with at least bachelor's degree education in the United States with a correlation coefficient (R) of -0.420 and weighted average of 39.8%, a difference of 2.8%.
Bachelor's Degree Correlation Summary
| Measurement | Albanian | Luxembourger |
| Minimum | 18.2% | 2.0% |
| Maximum | 76.7% | 62.9% |
| Range | 58.4% | 60.9% |
| Mean | 41.4% | 26.2% |
| Median | 41.4% | 25.1% |
| Interquartile 25% (IQ1) | 36.3% | 19.0% |
| Interquartile 75% (IQ3) | 44.8% | 32.2% |
| Interquartile Range (IQR) | 8.5% | 13.2% |
| Standard Deviation (Sample) | 11.2% | 12.2% |
| Standard Deviation (Population) | 11.1% | 12.1% |
Similar Demographics by Bachelor's Degree
Demographics Similar to Albanians by Bachelor's Degree
In terms of bachelor's degree, the demographic groups most similar to Albanians are Immigrants from Chile (40.8%, a difference of 0.050%), Arab (40.9%, a difference of 0.080%), Ukrainian (40.9%, a difference of 0.090%), Ugandan (40.8%, a difference of 0.090%), and Brazilian (40.8%, a difference of 0.14%).
| Demographics | Rating | Rank | Bachelor's Degree |
| Chileans | 97.5 /100 | #103 | Exceptional 41.2% |
| Jordanians | 97.4 /100 | #104 | Exceptional 41.2% |
| Syrians | 97.4 /100 | #105 | Exceptional 41.1% |
| Alsatians | 97.0 /100 | #106 | Exceptional 41.0% |
| Northern Europeans | 96.8 /100 | #107 | Exceptional 41.0% |
| Ukrainians | 96.6 /100 | #108 | Exceptional 40.9% |
| Arabs | 96.6 /100 | #109 | Exceptional 40.9% |
| Albanians | 96.5 /100 | #110 | Exceptional 40.9% |
| Immigrants | Chile | 96.4 /100 | #111 | Exceptional 40.8% |
| Ugandans | 96.3 /100 | #112 | Exceptional 40.8% |
| Brazilians | 96.3 /100 | #113 | Exceptional 40.8% |
| Afghans | 96.2 /100 | #114 | Exceptional 40.8% |
| Palestinians | 95.8 /100 | #115 | Exceptional 40.7% |
| Immigrants | Uganda | 95.7 /100 | #116 | Exceptional 40.7% |
| Austrians | 95.5 /100 | #117 | Exceptional 40.6% |
Demographics Similar to Luxembourgers by Bachelor's Degree
In terms of bachelor's degree, the demographic groups most similar to Luxembourgers are Assyrian/Chaldean/Syriac (39.8%, a difference of 0.080%), Pakistani (39.7%, a difference of 0.20%), Immigrants from Southern Europe (40.0%, a difference of 0.51%), Taiwanese (40.0%, a difference of 0.52%), and Icelander (39.5%, a difference of 0.57%).
| Demographics | Rating | Rank | Bachelor's Degree |
| Immigrants | Venezuela | 92.9 /100 | #128 | Exceptional 40.2% |
| Serbians | 92.4 /100 | #129 | Exceptional 40.1% |
| Sierra Leoneans | 92.2 /100 | #130 | Exceptional 40.1% |
| Italians | 91.9 /100 | #131 | Exceptional 40.1% |
| Taiwanese | 91.1 /100 | #132 | Exceptional 40.0% |
| Immigrants | Southern Europe | 91.1 /100 | #133 | Exceptional 40.0% |
| Assyrians/Chaldeans/Syriacs | 89.4 /100 | #134 | Excellent 39.8% |
| Luxembourgers | 89.1 /100 | #135 | Excellent 39.8% |
| Pakistanis | 88.2 /100 | #136 | Excellent 39.7% |
| Icelanders | 86.5 /100 | #137 | Excellent 39.5% |
| Europeans | 85.6 /100 | #138 | Excellent 39.5% |
| Immigrants | Sudan | 84.5 /100 | #139 | Excellent 39.4% |
| Immigrants | Armenia | 84.1 /100 | #140 | Excellent 39.4% |
| South American Indians | 83.6 /100 | #141 | Excellent 39.3% |
| Immigrants | North Macedonia | 81.6 /100 | #142 | Excellent 39.2% |