Albanian vs Immigrants from Cameroon Associate's Degree
COMPARE
Albanian
Immigrants from Cameroon
Associate's Degree
Associate's Degree Comparison
Albanians
Immigrants from Cameroon
48.8%
ASSOCIATE'S DEGREE
94.7/ 100
METRIC RATING
118th/ 347
METRIC RANK
45.7%
ASSOCIATE'S DEGREE
31.0/ 100
METRIC RATING
193rd/ 347
METRIC RANK
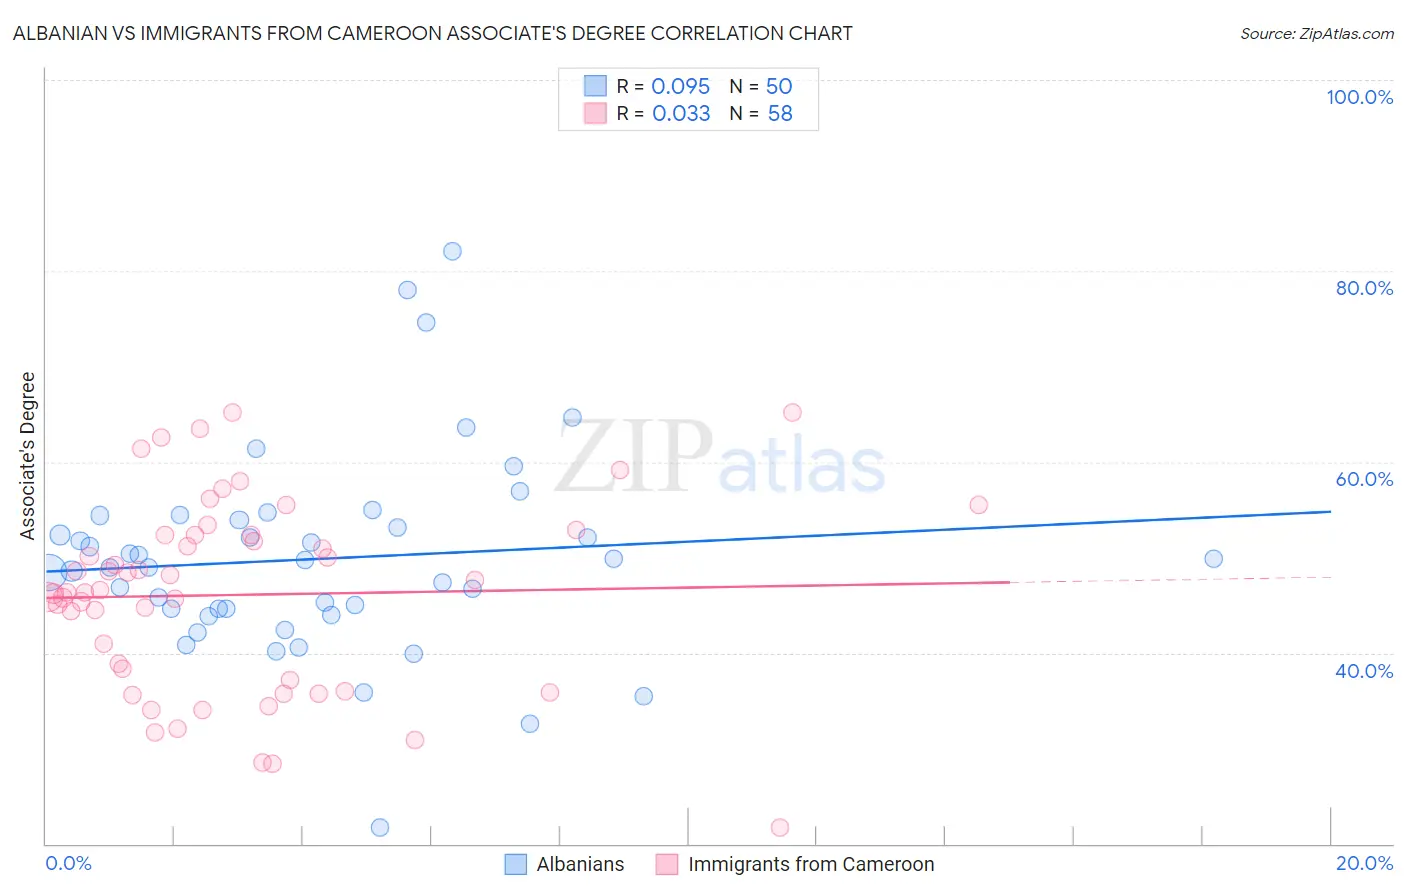
Albanian vs Immigrants from Cameroon Associate's Degree Correlation Chart
The statistical analysis conducted on geographies consisting of 193,247,791 people shows a slight positive correlation between the proportion of Albanians and percentage of population with at least associate's degree education in the United States with a correlation coefficient (R) of 0.095 and weighted average of 48.8%. Similarly, the statistical analysis conducted on geographies consisting of 130,766,713 people shows no correlation between the proportion of Immigrants from Cameroon and percentage of population with at least associate's degree education in the United States with a correlation coefficient (R) of 0.033 and weighted average of 45.7%, a difference of 7.0%.
Associate's Degree Correlation Summary
| Measurement | Albanian | Immigrants from Cameroon |
| Minimum | 21.7% | 21.7% |
| Maximum | 82.0% | 65.2% |
| Range | 60.3% | 43.4% |
| Mean | 49.8% | 46.1% |
| Median | 49.3% | 46.5% |
| Interquartile 25% (IQ1) | 44.6% | 37.1% |
| Interquartile 75% (IQ3) | 53.9% | 52.3% |
| Interquartile Range (IQR) | 9.3% | 15.2% |
| Standard Deviation (Sample) | 10.6% | 10.0% |
| Standard Deviation (Population) | 10.5% | 9.9% |
Similar Demographics by Associate's Degree
Demographics Similar to Albanians by Associate's Degree
In terms of associate's degree, the demographic groups most similar to Albanians are Lebanese (48.8%, a difference of 0.010%), Alsatian (48.8%, a difference of 0.030%), Afghan (48.9%, a difference of 0.060%), British (48.9%, a difference of 0.11%), and Luxembourger (48.9%, a difference of 0.17%).
| Demographics | Rating | Rank | Associate's Degree |
| Immigrants | Venezuela | 95.8 /100 | #111 | Exceptional 49.1% |
| Immigrants | Chile | 95.3 /100 | #112 | Exceptional 49.0% |
| Palestinians | 95.3 /100 | #113 | Exceptional 49.0% |
| Arabs | 95.3 /100 | #114 | Exceptional 49.0% |
| Luxembourgers | 95.1 /100 | #115 | Exceptional 48.9% |
| British | 95.0 /100 | #116 | Exceptional 48.9% |
| Afghans | 94.8 /100 | #117 | Exceptional 48.9% |
| Albanians | 94.7 /100 | #118 | Exceptional 48.8% |
| Lebanese | 94.6 /100 | #119 | Exceptional 48.8% |
| Alsatians | 94.6 /100 | #120 | Exceptional 48.8% |
| Ugandans | 93.9 /100 | #121 | Exceptional 48.7% |
| Italians | 93.9 /100 | #122 | Exceptional 48.7% |
| Brazilians | 93.7 /100 | #123 | Exceptional 48.7% |
| Serbians | 92.6 /100 | #124 | Exceptional 48.5% |
| Chinese | 92.5 /100 | #125 | Exceptional 48.5% |
Demographics Similar to Immigrants from Cameroon by Associate's Degree
In terms of associate's degree, the demographic groups most similar to Immigrants from Cameroon are Celtic (45.8%, a difference of 0.20%), Korean (45.8%, a difference of 0.24%), Vietnamese (45.8%, a difference of 0.26%), Immigrants from Oceania (45.8%, a difference of 0.32%), and Immigrants from Peru (45.5%, a difference of 0.32%).
| Demographics | Rating | Rank | Associate's Degree |
| Welsh | 37.9 /100 | #186 | Fair 45.9% |
| Immigrants | Uruguay | 35.5 /100 | #187 | Fair 45.8% |
| Ghanaians | 35.5 /100 | #188 | Fair 45.8% |
| Immigrants | Oceania | 34.7 /100 | #189 | Fair 45.8% |
| Vietnamese | 34.0 /100 | #190 | Fair 45.8% |
| Koreans | 33.8 /100 | #191 | Fair 45.8% |
| Celtics | 33.3 /100 | #192 | Fair 45.8% |
| Immigrants | Cameroon | 31.0 /100 | #193 | Fair 45.7% |
| Immigrants | Peru | 27.6 /100 | #194 | Fair 45.5% |
| Germans | 26.5 /100 | #195 | Fair 45.5% |
| French | 25.6 /100 | #196 | Fair 45.4% |
| Scotch-Irish | 22.3 /100 | #197 | Fair 45.3% |
| Immigrants | Bangladesh | 21.3 /100 | #198 | Fair 45.2% |
| Immigrants | Senegal | 21.2 /100 | #199 | Fair 45.2% |
| Senegalese | 21.1 /100 | #200 | Fair 45.2% |