Albanian vs Immigrants 8th Grade
COMPARE
Albanian
Immigrants
8th Grade
8th Grade Comparison
Albanians
Immigrants
96.0%
8TH GRADE
83.1/ 100
METRIC RATING
148th/ 347
METRIC RANK
93.6%
8TH GRADE
0.0/ 100
METRIC RATING
309th/ 347
METRIC RANK
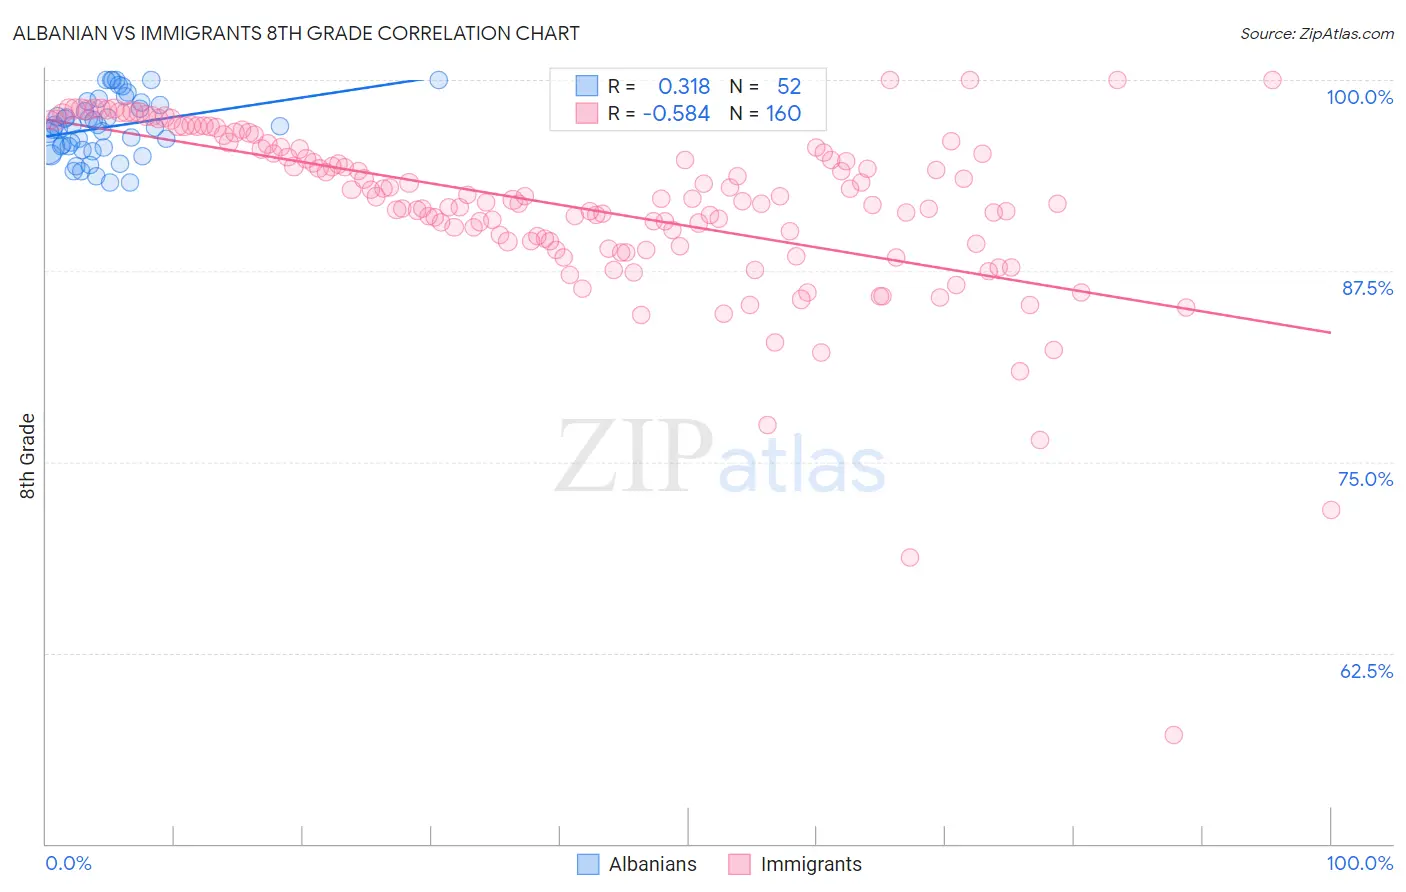
Albanian vs Immigrants 8th Grade Correlation Chart
The statistical analysis conducted on geographies consisting of 193,265,850 people shows a mild positive correlation between the proportion of Albanians and percentage of population with at least 8th grade education in the United States with a correlation coefficient (R) of 0.318 and weighted average of 96.0%. Similarly, the statistical analysis conducted on geographies consisting of 577,787,160 people shows a substantial negative correlation between the proportion of Immigrants and percentage of population with at least 8th grade education in the United States with a correlation coefficient (R) of -0.584 and weighted average of 93.6%, a difference of 2.6%.
8th Grade Correlation Summary
| Measurement | Albanian | Immigrants |
| Minimum | 93.3% | 57.2% |
| Maximum | 100.0% | 100.0% |
| Range | 6.7% | 42.8% |
| Mean | 96.9% | 91.8% |
| Median | 96.9% | 92.2% |
| Interquartile 25% (IQ1) | 95.6% | 89.4% |
| Interquartile 75% (IQ3) | 98.4% | 95.6% |
| Interquartile Range (IQR) | 2.8% | 6.1% |
| Standard Deviation (Sample) | 1.9% | 5.8% |
| Standard Deviation (Population) | 1.9% | 5.8% |
Similar Demographics by 8th Grade
Demographics Similar to Albanians by 8th Grade
In terms of 8th grade, the demographic groups most similar to Albanians are Lumbee (96.0%, a difference of 0.010%), Israeli (96.0%, a difference of 0.010%), Colville (96.0%, a difference of 0.010%), Spanish (96.0%, a difference of 0.020%), and Immigrants from Belarus (96.0%, a difference of 0.020%).
| Demographics | Rating | Rank | 8th Grade |
| Immigrants | Greece | 85.9 /100 | #141 | Excellent 96.0% |
| Immigrants | Eastern Europe | 85.4 /100 | #142 | Excellent 96.0% |
| Spanish | 85.1 /100 | #143 | Excellent 96.0% |
| Immigrants | Belarus | 84.8 /100 | #144 | Excellent 96.0% |
| Lumbee | 84.1 /100 | #145 | Excellent 96.0% |
| Israelis | 84.1 /100 | #146 | Excellent 96.0% |
| Colville | 84.0 /100 | #147 | Excellent 96.0% |
| Albanians | 83.1 /100 | #148 | Excellent 96.0% |
| Immigrants | Israel | 81.3 /100 | #149 | Excellent 96.0% |
| Immigrants | Russia | 80.9 /100 | #150 | Excellent 96.0% |
| Blackfeet | 80.8 /100 | #151 | Excellent 96.0% |
| French American Indians | 80.6 /100 | #152 | Excellent 96.0% |
| Immigrants | Jordan | 79.5 /100 | #153 | Good 95.9% |
| Hopi | 79.4 /100 | #154 | Good 95.9% |
| Kenyans | 74.5 /100 | #155 | Good 95.9% |
Demographics Similar to Immigrants by 8th Grade
In terms of 8th grade, the demographic groups most similar to Immigrants are Japanese (93.6%, a difference of 0.0%), Immigrants from Bangladesh (93.6%, a difference of 0.010%), Ecuadorian (93.6%, a difference of 0.020%), Cape Verdean (93.5%, a difference of 0.050%), and Immigrants from Caribbean (93.5%, a difference of 0.070%).
| Demographics | Rating | Rank | 8th Grade |
| Sri Lankans | 0.0 /100 | #302 | Tragic 94.0% |
| Immigrants | Dominica | 0.0 /100 | #303 | Tragic 94.0% |
| Guyanese | 0.0 /100 | #304 | Tragic 93.9% |
| Immigrants | Haiti | 0.0 /100 | #305 | Tragic 93.9% |
| Immigrants | Guyana | 0.0 /100 | #306 | Tragic 93.8% |
| Immigrants | Portugal | 0.0 /100 | #307 | Tragic 93.8% |
| Ecuadorians | 0.0 /100 | #308 | Tragic 93.6% |
| Immigrants | Immigrants | 0.0 /100 | #309 | Tragic 93.6% |
| Japanese | 0.0 /100 | #310 | Tragic 93.6% |
| Immigrants | Bangladesh | 0.0 /100 | #311 | Tragic 93.6% |
| Cape Verdeans | 0.0 /100 | #312 | Tragic 93.5% |
| Immigrants | Caribbean | 0.0 /100 | #313 | Tragic 93.5% |
| Immigrants | Vietnam | 0.0 /100 | #314 | Tragic 93.5% |
| Vietnamese | 0.0 /100 | #315 | Tragic 93.5% |
| Immigrants | Cambodia | 0.0 /100 | #316 | Tragic 93.3% |