Alaskan Athabascan vs Cypriot Professional Degree
COMPARE
Alaskan Athabascan
Cypriot
Professional Degree
Professional Degree Comparison
Alaskan Athabascans
Cypriots
3.8%
PROFESSIONAL DEGREE
2.3/ 100
METRIC RATING
241st/ 347
METRIC RANK
6.9%
PROFESSIONAL DEGREE
100.0/ 100
METRIC RATING
11th/ 347
METRIC RANK
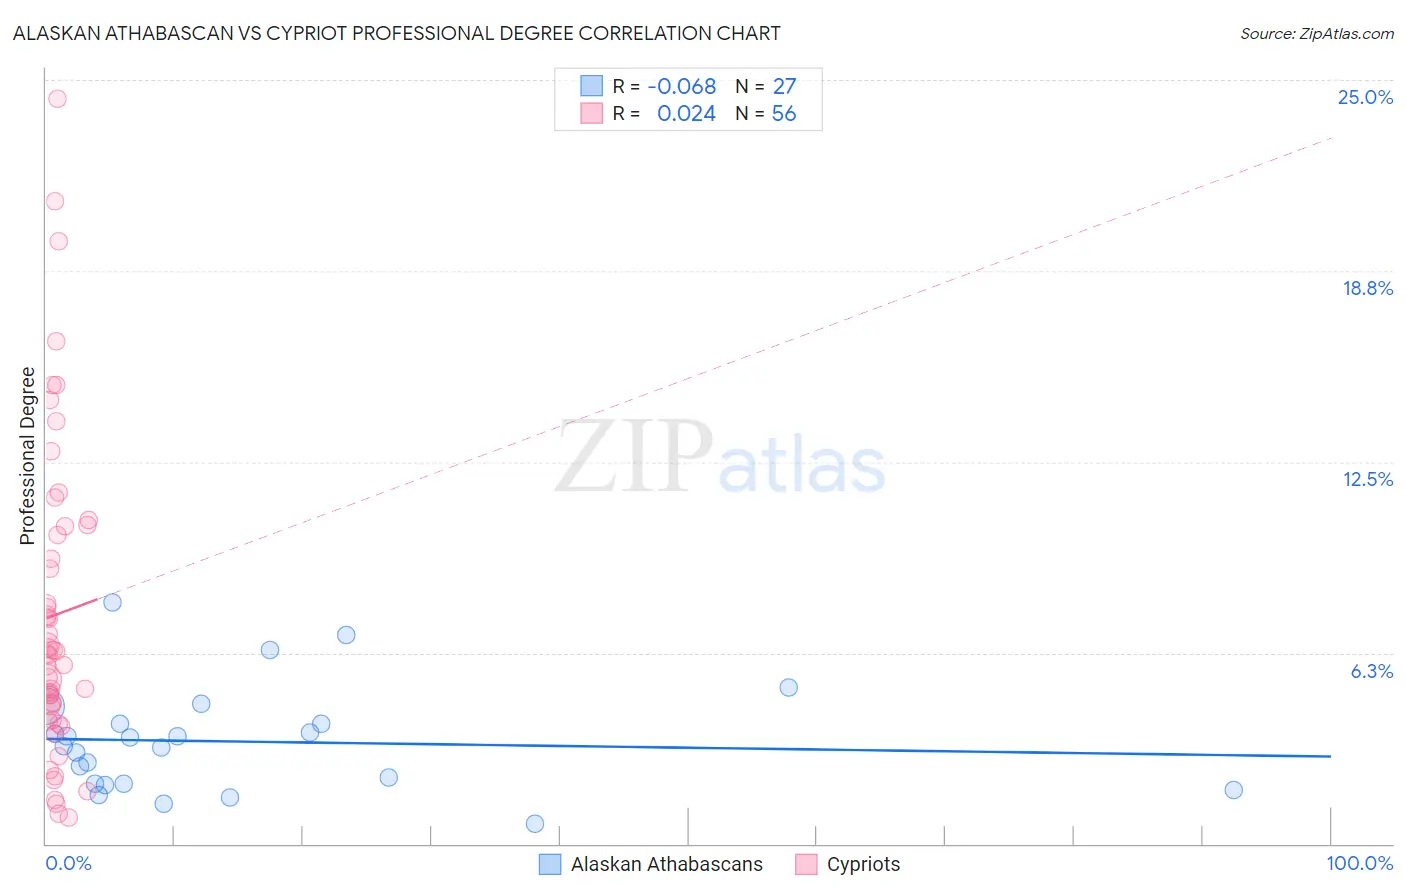
Alaskan Athabascan vs Cypriot Professional Degree Correlation Chart
The statistical analysis conducted on geographies consisting of 45,732,326 people shows a slight negative correlation between the proportion of Alaskan Athabascans and percentage of population with at least professional degree education in the United States with a correlation coefficient (R) of -0.068 and weighted average of 3.8%. Similarly, the statistical analysis conducted on geographies consisting of 61,833,042 people shows no correlation between the proportion of Cypriots and percentage of population with at least professional degree education in the United States with a correlation coefficient (R) of 0.024 and weighted average of 6.9%, a difference of 82.4%.
Professional Degree Correlation Summary
| Measurement | Alaskan Athabascan | Cypriot |
| Minimum | 0.64% | 0.85% |
| Maximum | 7.9% | 24.4% |
| Range | 7.2% | 23.5% |
| Mean | 3.3% | 7.5% |
| Median | 3.2% | 6.2% |
| Interquartile 25% (IQ1) | 2.0% | 4.3% |
| Interquartile 75% (IQ3) | 3.9% | 10.2% |
| Interquartile Range (IQR) | 2.0% | 6.0% |
| Standard Deviation (Sample) | 1.7% | 5.1% |
| Standard Deviation (Population) | 1.7% | 5.1% |
Similar Demographics by Professional Degree
Demographics Similar to Alaskan Athabascans by Professional Degree
In terms of professional degree, the demographic groups most similar to Alaskan Athabascans are Native Hawaiian (3.8%, a difference of 0.0%), Immigrants from Ecuador (3.8%, a difference of 0.020%), Guamanian/Chamorro (3.8%, a difference of 0.080%), British West Indian (3.8%, a difference of 0.25%), and Immigrants from Bahamas (3.8%, a difference of 0.51%).
| Demographics | Rating | Rank | Professional Degree |
| Immigrants | Nonimmigrants | 4.0 /100 | #234 | Tragic 3.9% |
| Immigrants | Barbados | 4.0 /100 | #235 | Tragic 3.9% |
| Spanish Americans | 3.8 /100 | #236 | Tragic 3.9% |
| Immigrants | Trinidad and Tobago | 3.8 /100 | #237 | Tragic 3.9% |
| Colville | 2.6 /100 | #238 | Tragic 3.8% |
| British West Indians | 2.4 /100 | #239 | Tragic 3.8% |
| Immigrants | Ecuador | 2.3 /100 | #240 | Tragic 3.8% |
| Alaskan Athabascans | 2.3 /100 | #241 | Tragic 3.8% |
| Native Hawaiians | 2.3 /100 | #242 | Tragic 3.8% |
| Guamanians/Chamorros | 2.2 /100 | #243 | Tragic 3.8% |
| Immigrants | Bahamas | 2.0 /100 | #244 | Tragic 3.8% |
| French American Indians | 1.7 /100 | #245 | Tragic 3.8% |
| Marshallese | 1.7 /100 | #246 | Tragic 3.8% |
| Guyanese | 1.6 /100 | #247 | Tragic 3.8% |
| Hmong | 1.6 /100 | #248 | Tragic 3.7% |
Demographics Similar to Cypriots by Professional Degree
In terms of professional degree, the demographic groups most similar to Cypriots are Israeli (6.9%, a difference of 0.070%), Immigrants from Belgium (7.0%, a difference of 0.17%), Immigrants from Australia (6.9%, a difference of 0.49%), Immigrants from Taiwan (7.1%, a difference of 1.9%), and Immigrants from France (6.8%, a difference of 2.0%).
| Demographics | Rating | Rank | Professional Degree |
| Filipinos | 100.0 /100 | #4 | Exceptional 7.6% |
| Immigrants | Iran | 100.0 /100 | #5 | Exceptional 7.3% |
| Okinawans | 100.0 /100 | #6 | Exceptional 7.3% |
| Eastern Europeans | 100.0 /100 | #7 | Exceptional 7.1% |
| Immigrants | Switzerland | 100.0 /100 | #8 | Exceptional 7.1% |
| Immigrants | Taiwan | 100.0 /100 | #9 | Exceptional 7.1% |
| Immigrants | Belgium | 100.0 /100 | #10 | Exceptional 7.0% |
| Cypriots | 100.0 /100 | #11 | Exceptional 6.9% |
| Israelis | 100.0 /100 | #12 | Exceptional 6.9% |
| Immigrants | Australia | 100.0 /100 | #13 | Exceptional 6.9% |
| Immigrants | France | 100.0 /100 | #14 | Exceptional 6.8% |
| Immigrants | China | 100.0 /100 | #15 | Exceptional 6.7% |
| Immigrants | Sweden | 100.0 /100 | #16 | Exceptional 6.7% |
| Immigrants | Eastern Asia | 100.0 /100 | #17 | Exceptional 6.6% |
| Soviet Union | 100.0 /100 | #18 | Exceptional 6.6% |