Alaska Native vs Immigrants from Western Africa 10th Grade
COMPARE
Alaska Native
Immigrants from Western Africa
10th Grade
10th Grade Comparison
Alaska Natives
Immigrants from Western Africa
94.9%
10TH GRADE
99.6/ 100
METRIC RATING
71st/ 347
METRIC RANK
92.5%
10TH GRADE
0.3/ 100
METRIC RATING
272nd/ 347
METRIC RANK
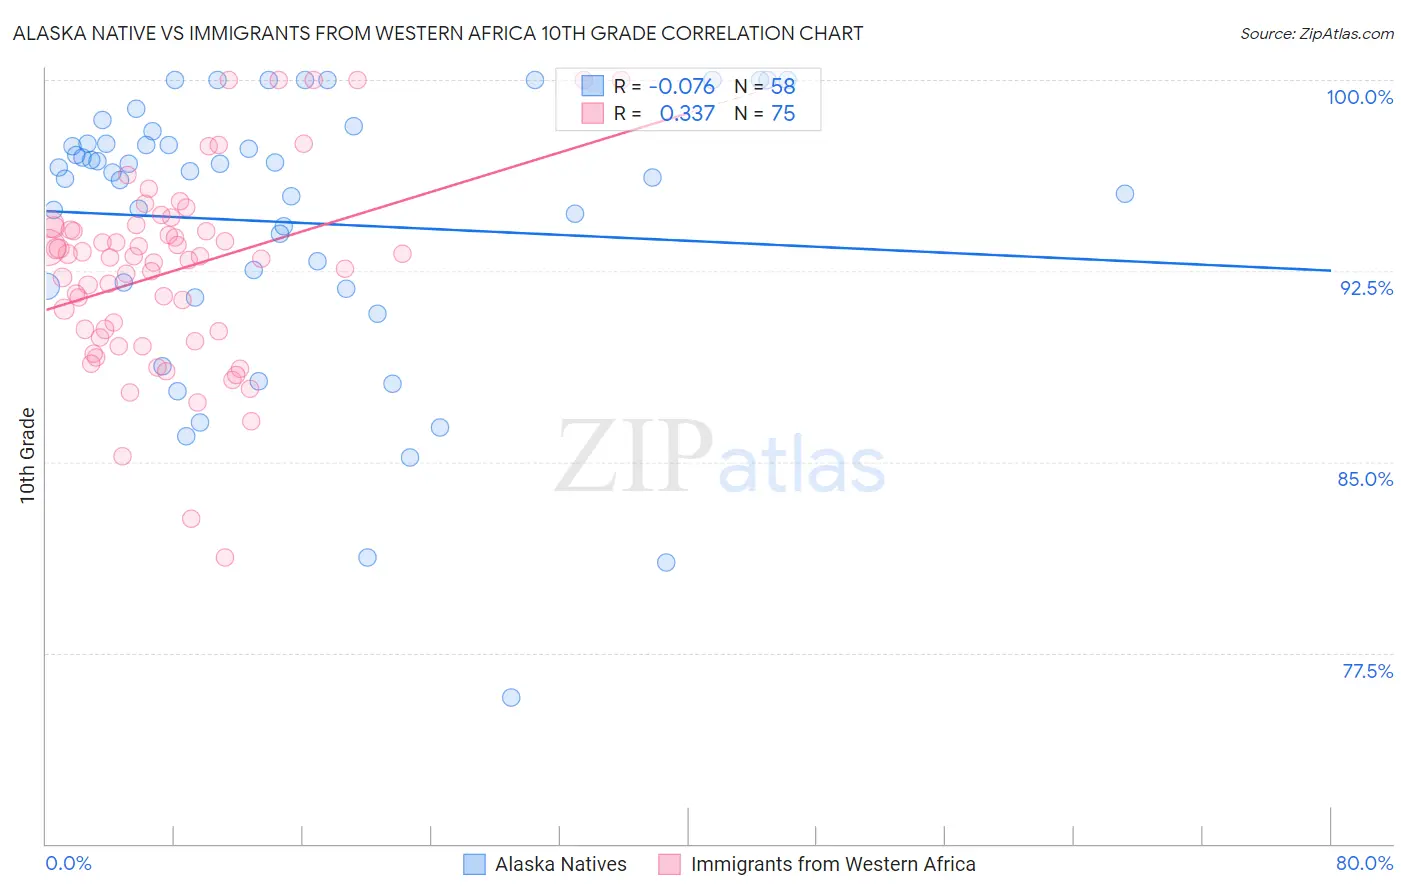
Alaska Native vs Immigrants from Western Africa 10th Grade Correlation Chart
The statistical analysis conducted on geographies consisting of 76,778,743 people shows a slight negative correlation between the proportion of Alaska Natives and percentage of population with at least 10th grade education in the United States with a correlation coefficient (R) of -0.076 and weighted average of 94.9%. Similarly, the statistical analysis conducted on geographies consisting of 357,883,667 people shows a mild positive correlation between the proportion of Immigrants from Western Africa and percentage of population with at least 10th grade education in the United States with a correlation coefficient (R) of 0.337 and weighted average of 92.5%, a difference of 2.6%.
10th Grade Correlation Summary
| Measurement | Alaska Native | Immigrants from Western Africa |
| Minimum | 75.7% | 81.2% |
| Maximum | 100.0% | 100.0% |
| Range | 24.3% | 18.8% |
| Mean | 94.4% | 92.5% |
| Median | 96.4% | 93.1% |
| Interquartile 25% (IQ1) | 91.9% | 89.9% |
| Interquartile 75% (IQ3) | 97.5% | 94.2% |
| Interquartile Range (IQR) | 5.6% | 4.3% |
| Standard Deviation (Sample) | 5.4% | 3.8% |
| Standard Deviation (Population) | 5.4% | 3.7% |
Similar Demographics by 10th Grade
Demographics Similar to Alaska Natives by 10th Grade
In terms of 10th grade, the demographic groups most similar to Alaska Natives are Zimbabwean (94.9%, a difference of 0.0%), Immigrants from England (94.9%, a difference of 0.010%), Immigrants from Sweden (94.9%, a difference of 0.020%), Bhutanese (94.9%, a difference of 0.020%), and Canadian (94.9%, a difference of 0.020%).
| Demographics | Rating | Rank | 10th Grade |
| Native Hawaiians | 99.7 /100 | #64 | Exceptional 95.0% |
| Turks | 99.7 /100 | #65 | Exceptional 95.0% |
| Immigrants | Australia | 99.7 /100 | #66 | Exceptional 94.9% |
| Immigrants | Netherlands | 99.7 /100 | #67 | Exceptional 94.9% |
| Immigrants | Belgium | 99.7 /100 | #68 | Exceptional 94.9% |
| Immigrants | England | 99.6 /100 | #69 | Exceptional 94.9% |
| Zimbabweans | 99.6 /100 | #70 | Exceptional 94.9% |
| Alaska Natives | 99.6 /100 | #71 | Exceptional 94.9% |
| Immigrants | Sweden | 99.6 /100 | #72 | Exceptional 94.9% |
| Bhutanese | 99.6 /100 | #73 | Exceptional 94.9% |
| Canadians | 99.6 /100 | #74 | Exceptional 94.9% |
| Okinawans | 99.5 /100 | #75 | Exceptional 94.8% |
| Romanians | 99.5 /100 | #76 | Exceptional 94.8% |
| Immigrants | South Africa | 99.5 /100 | #77 | Exceptional 94.8% |
| Filipinos | 99.3 /100 | #78 | Exceptional 94.8% |
Demographics Similar to Immigrants from Western Africa by 10th Grade
In terms of 10th grade, the demographic groups most similar to Immigrants from Western Africa are Immigrants from Eritrea (92.5%, a difference of 0.010%), Immigrants from Colombia (92.5%, a difference of 0.020%), Immigrants from Uruguay (92.5%, a difference of 0.020%), Taiwanese (92.5%, a difference of 0.040%), and Immigrants from Ghana (92.5%, a difference of 0.040%).
| Demographics | Rating | Rank | 10th Grade |
| Dutch West Indians | 0.4 /100 | #265 | Tragic 92.6% |
| Immigrants | Philippines | 0.4 /100 | #266 | Tragic 92.6% |
| Taiwanese | 0.3 /100 | #267 | Tragic 92.5% |
| Immigrants | Ghana | 0.3 /100 | #268 | Tragic 92.5% |
| Immigrants | Colombia | 0.3 /100 | #269 | Tragic 92.5% |
| Immigrants | Uruguay | 0.3 /100 | #270 | Tragic 92.5% |
| Immigrants | Eritrea | 0.3 /100 | #271 | Tragic 92.5% |
| Immigrants | Western Africa | 0.3 /100 | #272 | Tragic 92.5% |
| Trinidadians and Tobagonians | 0.2 /100 | #273 | Tragic 92.4% |
| Immigrants | Congo | 0.2 /100 | #274 | Tragic 92.4% |
| West Indians | 0.2 /100 | #275 | Tragic 92.4% |
| Immigrants | Trinidad and Tobago | 0.1 /100 | #276 | Tragic 92.3% |
| Navajo | 0.1 /100 | #277 | Tragic 92.3% |
| Barbadians | 0.1 /100 | #278 | Tragic 92.2% |
| Natives/Alaskans | 0.1 /100 | #279 | Tragic 92.2% |