Alaska Native vs Immigrants from South Central Asia Professional Degree
COMPARE
Alaska Native
Immigrants from South Central Asia
Professional Degree
Professional Degree Comparison
Alaska Natives
Immigrants from South Central Asia
3.5%
PROFESSIONAL DEGREE
0.3/ 100
METRIC RATING
291st/ 347
METRIC RANK
5.9%
PROFESSIONAL DEGREE
100.0/ 100
METRIC RATING
45th/ 347
METRIC RANK
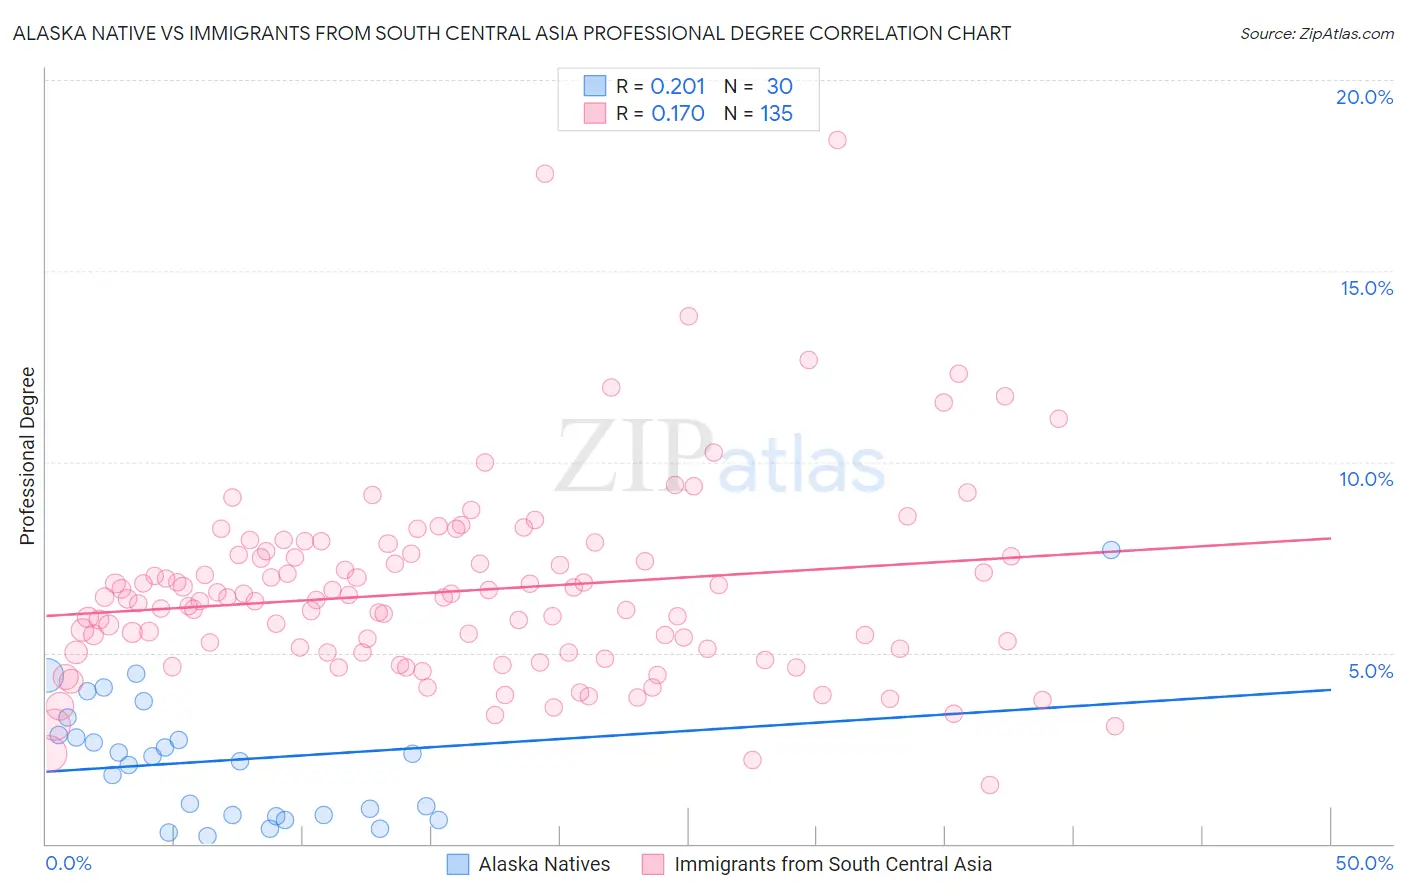
Alaska Native vs Immigrants from South Central Asia Professional Degree Correlation Chart
The statistical analysis conducted on geographies consisting of 76,648,508 people shows a weak positive correlation between the proportion of Alaska Natives and percentage of population with at least professional degree education in the United States with a correlation coefficient (R) of 0.201 and weighted average of 3.5%. Similarly, the statistical analysis conducted on geographies consisting of 471,835,732 people shows a poor positive correlation between the proportion of Immigrants from South Central Asia and percentage of population with at least professional degree education in the United States with a correlation coefficient (R) of 0.170 and weighted average of 5.9%, a difference of 70.4%.
Professional Degree Correlation Summary
| Measurement | Alaska Native | Immigrants from South Central Asia |
| Minimum | 0.21% | 1.5% |
| Maximum | 7.7% | 18.4% |
| Range | 7.5% | 16.9% |
| Mean | 2.2% | 6.6% |
| Median | 2.2% | 6.4% |
| Interquartile 25% (IQ1) | 0.74% | 5.0% |
| Interquartile 75% (IQ3) | 2.9% | 7.6% |
| Interquartile Range (IQR) | 2.1% | 2.5% |
| Standard Deviation (Sample) | 1.7% | 2.5% |
| Standard Deviation (Population) | 1.7% | 2.5% |
Similar Demographics by Professional Degree
Demographics Similar to Alaska Natives by Professional Degree
In terms of professional degree, the demographic groups most similar to Alaska Natives are Immigrants from Belize (3.5%, a difference of 0.070%), Chippewa (3.5%, a difference of 0.17%), Guatemalan (3.5%, a difference of 0.18%), Immigrants from Honduras (3.5%, a difference of 0.30%), and Blackfeet (3.5%, a difference of 0.36%).
| Demographics | Rating | Rank | Professional Degree |
| Salvadorans | 0.4 /100 | #284 | Tragic 3.5% |
| Hondurans | 0.3 /100 | #285 | Tragic 3.5% |
| Haitians | 0.3 /100 | #286 | Tragic 3.5% |
| Immigrants | El Salvador | 0.3 /100 | #287 | Tragic 3.5% |
| Blackfeet | 0.3 /100 | #288 | Tragic 3.5% |
| Guatemalans | 0.3 /100 | #289 | Tragic 3.5% |
| Chippewa | 0.3 /100 | #290 | Tragic 3.5% |
| Alaska Natives | 0.3 /100 | #291 | Tragic 3.5% |
| Immigrants | Belize | 0.3 /100 | #292 | Tragic 3.5% |
| Immigrants | Honduras | 0.3 /100 | #293 | Tragic 3.5% |
| Paiute | 0.3 /100 | #294 | Tragic 3.4% |
| Immigrants | Guatemala | 0.2 /100 | #295 | Tragic 3.4% |
| Hawaiians | 0.2 /100 | #296 | Tragic 3.4% |
| Immigrants | Liberia | 0.2 /100 | #297 | Tragic 3.4% |
| Ottawa | 0.2 /100 | #298 | Tragic 3.4% |
Demographics Similar to Immigrants from South Central Asia by Professional Degree
In terms of professional degree, the demographic groups most similar to Immigrants from South Central Asia are Immigrants from Argentina (5.9%, a difference of 0.21%), Australian (5.9%, a difference of 0.22%), Argentinean (5.9%, a difference of 0.45%), Immigrants from Saudi Arabia (5.9%, a difference of 0.61%), and Paraguayan (5.9%, a difference of 0.63%).
| Demographics | Rating | Rank | Professional Degree |
| Immigrants | Norway | 100.0 /100 | #38 | Exceptional 6.0% |
| Immigrants | South Africa | 100.0 /100 | #39 | Exceptional 6.0% |
| Cambodians | 100.0 /100 | #40 | Exceptional 6.0% |
| New Zealanders | 100.0 /100 | #41 | Exceptional 6.0% |
| Estonians | 100.0 /100 | #42 | Exceptional 6.0% |
| Immigrants | Saudi Arabia | 100.0 /100 | #43 | Exceptional 5.9% |
| Argentineans | 100.0 /100 | #44 | Exceptional 5.9% |
| Immigrants | South Central Asia | 100.0 /100 | #45 | Exceptional 5.9% |
| Immigrants | Argentina | 100.0 /100 | #46 | Exceptional 5.9% |
| Australians | 100.0 /100 | #47 | Exceptional 5.9% |
| Paraguayans | 100.0 /100 | #48 | Exceptional 5.9% |
| Immigrants | Latvia | 100.0 /100 | #49 | Exceptional 5.8% |
| Immigrants | Czechoslovakia | 100.0 /100 | #50 | Exceptional 5.8% |
| Immigrants | Greece | 100.0 /100 | #51 | Exceptional 5.8% |
| Immigrants | Serbia | 100.0 /100 | #52 | Exceptional 5.8% |