Alaska Native vs Bulgarian Bachelor's Degree
COMPARE
Alaska Native
Bulgarian
Bachelor's Degree
Bachelor's Degree Comparison
Alaska Natives
Bulgarians
29.4%
BACHELOR'S DEGREE
0.0/ 100
METRIC RATING
313th/ 347
METRIC RANK
45.3%
BACHELOR'S DEGREE
100.0/ 100
METRIC RATING
38th/ 347
METRIC RANK
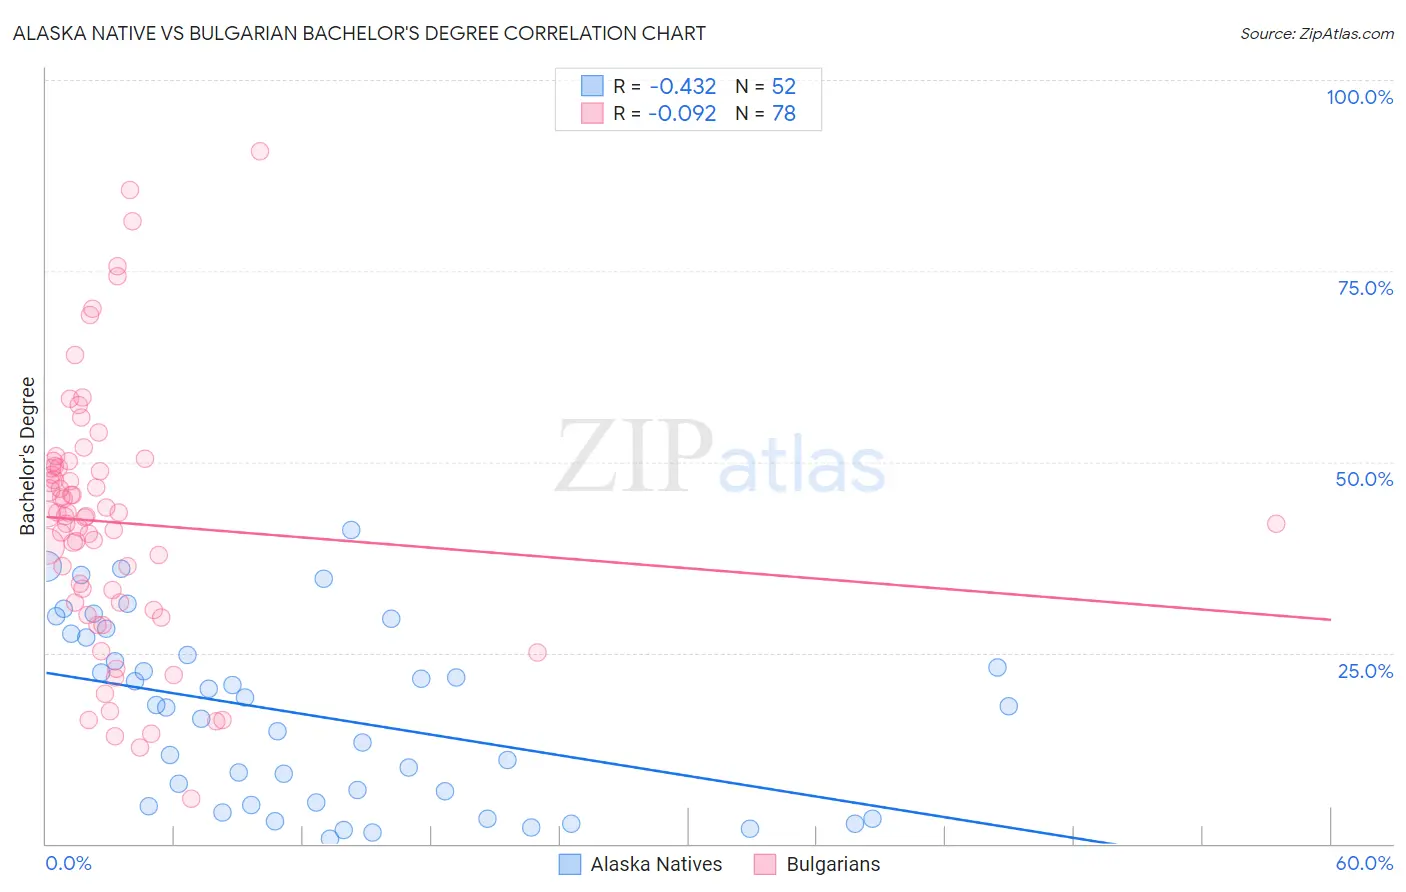
Alaska Native vs Bulgarian Bachelor's Degree Correlation Chart
The statistical analysis conducted on geographies consisting of 76,776,170 people shows a moderate negative correlation between the proportion of Alaska Natives and percentage of population with at least bachelor's degree education in the United States with a correlation coefficient (R) of -0.432 and weighted average of 29.4%. Similarly, the statistical analysis conducted on geographies consisting of 205,616,676 people shows a slight negative correlation between the proportion of Bulgarians and percentage of population with at least bachelor's degree education in the United States with a correlation coefficient (R) of -0.092 and weighted average of 45.3%, a difference of 54.3%.
Bachelor's Degree Correlation Summary
| Measurement | Alaska Native | Bulgarian |
| Minimum | 0.66% | 5.9% |
| Maximum | 41.1% | 90.7% |
| Range | 40.4% | 84.8% |
| Mean | 16.8% | 42.0% |
| Median | 17.9% | 42.9% |
| Interquartile 25% (IQ1) | 5.2% | 31.5% |
| Interquartile 75% (IQ3) | 25.9% | 49.3% |
| Interquartile Range (IQR) | 20.6% | 17.7% |
| Standard Deviation (Sample) | 11.5% | 16.8% |
| Standard Deviation (Population) | 11.4% | 16.7% |
Similar Demographics by Bachelor's Degree
Demographics Similar to Alaska Natives by Bachelor's Degree
In terms of bachelor's degree, the demographic groups most similar to Alaska Natives are Seminole (29.4%, a difference of 0.18%), Choctaw (29.4%, a difference of 0.24%), Shoshone (29.3%, a difference of 0.29%), Cheyenne (29.4%, a difference of 0.31%), and Immigrants from Cabo Verde (29.2%, a difference of 0.37%).
| Demographics | Rating | Rank | Bachelor's Degree |
| Immigrants | Yemen | 0.0 /100 | #306 | Tragic 29.9% |
| Nepalese | 0.0 /100 | #307 | Tragic 29.9% |
| Cajuns | 0.0 /100 | #308 | Tragic 29.6% |
| Hispanics or Latinos | 0.0 /100 | #309 | Tragic 29.6% |
| Cheyenne | 0.0 /100 | #310 | Tragic 29.4% |
| Choctaw | 0.0 /100 | #311 | Tragic 29.4% |
| Seminole | 0.0 /100 | #312 | Tragic 29.4% |
| Alaska Natives | 0.0 /100 | #313 | Tragic 29.4% |
| Shoshone | 0.0 /100 | #314 | Tragic 29.3% |
| Immigrants | Cabo Verde | 0.0 /100 | #315 | Tragic 29.2% |
| Sioux | 0.0 /100 | #316 | Tragic 29.1% |
| Colville | 0.0 /100 | #317 | Tragic 29.0% |
| Yaqui | 0.0 /100 | #318 | Tragic 29.0% |
| Creek | 0.0 /100 | #319 | Tragic 28.9% |
| Kiowa | 0.0 /100 | #320 | Tragic 28.8% |
Demographics Similar to Bulgarians by Bachelor's Degree
In terms of bachelor's degree, the demographic groups most similar to Bulgarians are Russian (45.3%, a difference of 0.090%), Mongolian (45.4%, a difference of 0.24%), Immigrants from Russia (45.4%, a difference of 0.26%), Immigrants from Denmark (45.4%, a difference of 0.28%), and Immigrants from Latvia (45.1%, a difference of 0.33%).
| Demographics | Rating | Rank | Bachelor's Degree |
| Latvians | 100.0 /100 | #31 | Exceptional 46.1% |
| Immigrants | Turkey | 100.0 /100 | #32 | Exceptional 46.0% |
| Immigrants | Northern Europe | 100.0 /100 | #33 | Exceptional 45.6% |
| Immigrants | Denmark | 100.0 /100 | #34 | Exceptional 45.4% |
| Immigrants | Russia | 100.0 /100 | #35 | Exceptional 45.4% |
| Mongolians | 100.0 /100 | #36 | Exceptional 45.4% |
| Russians | 100.0 /100 | #37 | Exceptional 45.3% |
| Bulgarians | 100.0 /100 | #38 | Exceptional 45.3% |
| Immigrants | Latvia | 100.0 /100 | #39 | Exceptional 45.1% |
| Immigrants | Belarus | 100.0 /100 | #40 | Exceptional 45.0% |
| Immigrants | Malaysia | 100.0 /100 | #41 | Exceptional 45.0% |
| Immigrants | Saudi Arabia | 100.0 /100 | #42 | Exceptional 44.8% |
| Immigrants | South Africa | 99.9 /100 | #43 | Exceptional 44.8% |
| Immigrants | Lithuania | 99.9 /100 | #44 | Exceptional 44.6% |
| Immigrants | Kuwait | 99.9 /100 | #45 | Exceptional 44.6% |