African vs Immigrants from Nepal 11th Grade

COMPARE

African
Race
Ancestry
AfghanAfricanAlaska NativeAlaskan AthabascanAlbanianAleutAlsatianAmericanApacheArabArapahoArgentineanArmenianAssyrian/Chaldean/SyriacAustralianAustrianBahamianBangladeshiBarbadianBasqueBelgianBelizeanBermudanBhutaneseBlackfeetBolivianBrazilianBritishBritish West IndianBulgarianBurmeseCajunCambodianCanadianCape VerdeanCarpatho RusynCelticCentral AmericanCentral American IndianCherokeeCheyenneChickasawChileanChineseChippewaChoctawColombianColvilleComancheCosta RicanCreeCreekCroatianCrowCubanCypriotCzechCzechoslovakianDanishDelawareDominicanDutchDutch West IndianEastern EuropeanEcuadorianEgyptianEnglishEstonianEthiopianEuropeanFijianFilipinoFinnishFrenchFrench American IndianFrench CanadianGermanGerman RussianGhanaianGreekGuamanian/ChamorroGuatemalanGuyaneseHaitianHmongHonduranHopiHoumaHungarianIcelanderIndian (Asian)IndonesianInupiatIranianIraqiIrishIroquoisIsraeliItalianJamaicanJapaneseJordanianKenyanKiowaKoreanLaotianLatvianLebaneseLiberianLithuanianLumbeeLuxembourgerMacedonianMalaysianMalteseMarshalleseMenomineeMexicanMexican American IndianMongolianMoroccanNative HawaiianNavajoNepaleseNew ZealanderNicaraguanNigerianNorthern EuropeanNorwegianOkinawanOsageOttawaPaiutePakistaniPalestinianPanamanianParaguayanPennsylvania GermanPeruvianPimaPolishPortuguesePotawatomiPuebloPuerto RicanPuget Sound SalishRomanianRussianSalvadoranSamoanScandinavianScotch-IrishScottishSeminoleSenegaleseSerbianShoshoneSierra LeoneanSiouxSlavicSlovakSloveneSomaliSouth AfricanSouth AmericanSouth American IndianSoviet UnionSpaniardSpanishSpanish AmericanSpanish American IndianSri LankanSubsaharan AfricanSudaneseSwedishSwissSyrianTaiwaneseThaiTlingit-HaidaTohono O'OdhamTonganTrinidadian and TobagonianTsimshianTurkishU.S. Virgin IslanderUgandanUkrainianUruguayanUteVenezuelanVietnameseWelshWest IndianYakamaYaquiYugoslavianYumanYup'ikZimbabwean
Immigration
NonimmigrantsImmigrantsAfghanistanAfricaAlbaniaArgentinaArmeniaAsiaAustraliaAustriaBahamasBangladeshBarbadosBelarusBelgiumBelizeBoliviaBosnia and HerzegovinaBrazilBulgariaBurma/MyanmarCabo VerdeCambodiaCameroonCanadaCaribbeanCentral AmericaChileChinaColombiaCongoCosta RicaCroatiaCubaCzechoslovakiaDenmarkDominicaDominican RepublicEastern AfricaEastern AsiaEastern EuropeEcuadorEgyptEl SalvadorEnglandEritreaEthiopiaEuropeFijiFranceGermanyGhanaGreeceGrenadaGuatemalaGuyanaHaitiHondurasHong KongHungaryIndiaIndonesiaIranIraqIrelandIsraelItalyJamaicaJapanJordanKazakhstanKenyaKoreaKuwaitLaosLatin AmericaLatviaLebanonLiberiaLithuaniaMalaysiaMexicoMicronesiaMiddle AfricaMoldovaMoroccoNetherlandsNicaraguaNigeriaNorth AmericaNorth MacedoniaNorthern AfricaNorthern EuropeNorwayOceaniaPakistanPanamaPeruPhilippinesPolandPortugalRomaniaRussiaSaudi ArabiaScotlandSenegalSerbiaSierra LeoneSingaporeSomaliaSouth AfricaSouth AmericaSouth Central AsiaSouth Eastern AsiaSouthern EuropeSpainSri LankaSt. Vincent and the GrenadinesSudanSwedenSwitzerlandSyriaTaiwanThailandTrinidad and TobagoTurkeyUgandaUkraineUruguayUzbekistanVenezuelaVietnamWest IndiesWestern AfricaWestern AsiaWestern EuropeYemenZaireZimbabweAzores
Immigrants from Nepal
Race
Ancestry
AfghanAlaska NativeAlaskan AthabascanAlbanianAleutAlsatianAmericanApacheArabArapahoArgentineanArmenianAssyrian/Chaldean/SyriacAustralianAustrianBahamianBangladeshiBarbadianBasqueBelgianBelizeanBermudanBhutaneseBlackfeetBolivianBrazilianBritishBritish West IndianBulgarianBurmeseCajunCambodianCanadianCape VerdeanCarpatho RusynCelticCentral AmericanCentral American IndianCherokeeCheyenneChickasawChileanChineseChippewaChoctawColombianColvilleComancheCosta RicanCreeCreekCroatianCrowCubanCypriotCzechCzechoslovakianDanishDelawareDominicanDutchDutch West IndianEastern EuropeanEcuadorianEgyptianEnglishEstonianEthiopianEuropeanFijianFilipinoFinnishFrenchFrench American IndianFrench CanadianGermanGerman RussianGhanaianGreekGuamanian/ChamorroGuatemalanGuyaneseHaitianHmongHonduranHopiHoumaHungarianIcelanderIndian (Asian)IndonesianInupiatIranianIraqiIrishIroquoisIsraeliItalianJamaicanJapaneseJordanianKenyanKiowaKoreanLaotianLatvianLebaneseLiberianLithuanianLumbeeLuxembourgerMacedonianMalaysianMalteseMarshalleseMenomineeMexicanMexican American IndianMongolianMoroccanNative HawaiianNavajoNepaleseNew ZealanderNicaraguanNigerianNorthern EuropeanNorwegianOkinawanOsageOttawaPaiutePakistaniPalestinianPanamanianParaguayanPennsylvania GermanPeruvianPimaPolishPortuguesePotawatomiPuebloPuerto RicanPuget Sound SalishRomanianRussianSalvadoranSamoanScandinavianScotch-IrishScottishSeminoleSenegaleseSerbianShoshoneSierra LeoneanSiouxSlavicSlovakSloveneSomaliSouth AfricanSouth AmericanSouth American IndianSoviet UnionSpaniardSpanishSpanish AmericanSpanish American IndianSri LankanSubsaharan AfricanSudaneseSwedishSwissSyrianTaiwaneseThaiTlingit-HaidaTohono O'OdhamTonganTrinidadian and TobagonianTsimshianTurkishU.S. Virgin IslanderUgandanUkrainianUruguayanUteVenezuelanVietnameseWelshWest IndianYakamaYaquiYugoslavianYumanYup'ikZimbabwean
Immigration
NonimmigrantsImmigrantsAfghanistanAfricaAlbaniaArgentinaArmeniaAsiaAustraliaAustriaBahamasBangladeshBarbadosBelarusBelgiumBelizeBoliviaBosnia and HerzegovinaBrazilBulgariaBurma/MyanmarCabo VerdeCambodiaCameroonCanadaCaribbeanCentral AmericaChileChinaColombiaCongoCosta RicaCroatiaCubaCzechoslovakiaDenmarkDominicaDominican RepublicEastern AfricaEastern AsiaEastern EuropeEcuadorEgyptEl SalvadorEnglandEritreaEthiopiaEuropeFijiFranceGermanyGhanaGreeceGrenadaGuatemalaGuyanaHaitiHondurasHong KongHungaryIndiaIndonesiaIranIraqIrelandIsraelItalyJamaicaJapanJordanKazakhstanKenyaKoreaKuwaitLaosLatin AmericaLatviaLebanonLiberiaLithuaniaMalaysiaMexicoMicronesiaMiddle AfricaMoldovaMoroccoNepalNetherlandsNicaraguaNigeriaNorth AmericaNorth MacedoniaNorthern AfricaNorthern EuropeNorwayOceaniaPakistanPanamaPeruPhilippinesPolandPortugalRomaniaRussiaSaudi ArabiaScotlandSenegalSerbiaSierra LeoneSingaporeSomaliaSouth AfricaSouth AmericaSouth Central AsiaSouth Eastern AsiaSouthern EuropeSpainSri LankaSt. Vincent and the GrenadinesSudanSwedenSwitzerlandSyriaTaiwanThailandTrinidad and TobagoTurkeyUgandaUkraineUruguayUzbekistanVenezuelaVietnamWest IndiesWestern AfricaWestern AsiaWestern EuropeYemenZaireZimbabweAzores
11th Grade
Income
Poverty
Unemployment
Labor Participation
Family Structure
Vehicle Availability
Education Level
Disability

11th Grade Comparison

Africans

Immigrants from Nepal

Tragic
Fair
91.5%
11TH GRADE
1.3/ 100
METRIC RATING
245th/ 347
METRIC RANK
92.4%
11TH GRADE
36.4/ 100
METRIC RATING
185th/ 347
METRIC RANK

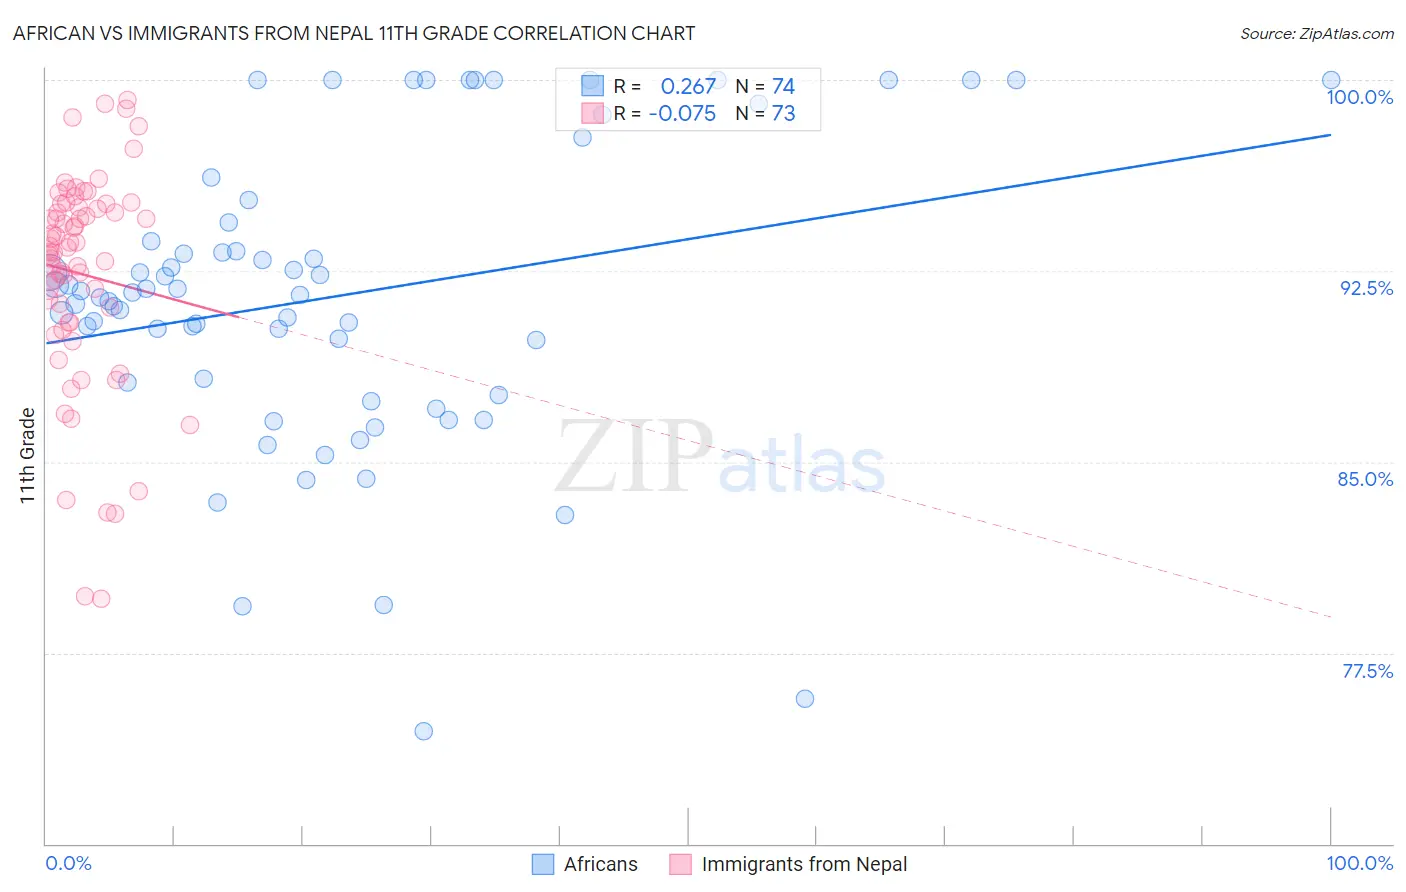
African vs Immigrants from Nepal 11th Grade Correlation Chart

The statistical analysis conducted on geographies consisting of 470,094,658 people shows a weak positive correlation between the proportion of Africans and percentage of population with at least 11th grade education in the United States with a correlation coefficient (R) of 0.267 and weighted average of 91.5%. Similarly, the statistical analysis conducted on geographies consisting of 186,780,807 people shows a slight negative correlation between the proportion of Immigrants from Nepal and percentage of population with at least 11th grade education in the United States with a correlation coefficient (R) of -0.075 and weighted average of 92.4%, a difference of 0.93%.
African vs Immigrants from Nepal 11th Grade

11th Grade Correlation Summary

MeasurementAfricanImmigrants from Nepal
Minimum74.4%79.6%
Maximum100.0%99.2%
Range25.6%19.6%
Mean91.5%92.4%
Median91.6%93.4%
Interquartile 25% (IQ1)88.1%90.5%
Interquartile 75% (IQ3)94.4%95.1%
Interquartile Range (IQR)6.3%4.6%
Standard Deviation (Sample)5.9%4.2%
Standard Deviation (Population)5.8%4.2%

Similar Demographics by 11th Grade

Demographics Similar to Africans by 11th Grade

In terms of 11th grade, the demographic groups most similar to Africans are Senegalese (91.6%, a difference of 0.010%), Immigrants from Thailand (91.6%, a difference of 0.020%), Seminole (91.5%, a difference of 0.030%), Immigrants from Middle Africa (91.6%, a difference of 0.050%), and Immigrants from Philippines (91.5%, a difference of 0.070%).
DemographicsRating | Rank11th Grade
Comanche
2.6
/100
|
#238
Tragic
91.7%
Hopi
2.5
/100
|
#239
Tragic
91.7%
South Americans
2.0
/100
|
#240
Tragic
91.6%
Bahamians
1.8
/100
|
#241
Tragic
91.6%
Immigrants | Middle Africa
1.6
/100
|
#242
Tragic
91.6%
Immigrants | Thailand
1.4
/100
|
#243
Tragic
91.6%
Senegalese
1.4
/100
|
#244
Tragic
91.6%
Africans
1.3
/100
|
#245
Tragic
91.5%
Seminole
1.2
/100
|
#246
Tragic
91.5%
Immigrants | Philippines
1.0
/100
|
#247
Tragic
91.5%
Immigrants | Uzbekistan
1.0
/100
|
#248
Tragic
91.5%
Peruvians
1.0
/100
|
#249
Tragic
91.5%
Ghanaians
0.9
/100
|
#250
Tragic
91.5%
Immigrants | Costa Rica
0.9
/100
|
#251
Tragic
91.4%
Immigrants | Nigeria
0.8
/100
|
#252
Tragic
91.4%

Demographics Similar to Immigrants from Nepal by 11th Grade

In terms of 11th grade, the demographic groups most similar to Immigrants from Nepal are Immigrants from Malaysia (92.4%, a difference of 0.010%), Immigrants from Asia (92.4%, a difference of 0.010%), Arapaho (92.4%, a difference of 0.010%), Immigrants from Morocco (92.4%, a difference of 0.020%), and Immigrants from Western Asia (92.4%, a difference of 0.020%).
DemographicsRating | Rank11th Grade
Sudanese
43.4
/100
|
#178
Average
92.5%
Creek
40.9
/100
|
#179
Average
92.4%
Inupiat
40.7
/100
|
#180
Average
92.4%
Cherokee
40.7
/100
|
#181
Average
92.4%
Immigrants | Morocco
38.6
/100
|
#182
Fair
92.4%
Immigrants | Malaysia
37.6
/100
|
#183
Fair
92.4%
Immigrants | Asia
37.4
/100
|
#184
Fair
92.4%
Immigrants | Nepal
36.4
/100
|
#185
Fair
92.4%
Arapaho
35.1
/100
|
#186
Fair
92.4%
Immigrants | Western Asia
35.0
/100
|
#187
Fair
92.4%
Immigrants | Indonesia
33.7
/100
|
#188
Fair
92.4%
Immigrants | Chile
33.3
/100
|
#189
Fair
92.4%
Chickasaw
31.4
/100
|
#190
Fair
92.3%
French American Indians
30.8
/100
|
#191
Fair
92.3%
Immigrants | Syria
30.4
/100
|
#192
Fair
92.3%