African vs Immigrants from Kazakhstan 3rd Grade
COMPARE
African
Immigrants from Kazakhstan
3rd Grade
3rd Grade Comparison
Africans
Immigrants from Kazakhstan
97.6%
3RD GRADE
14.5/ 100
METRIC RATING
205th/ 347
METRIC RANK
97.7%
3RD GRADE
37.4/ 100
METRIC RATING
184th/ 347
METRIC RANK
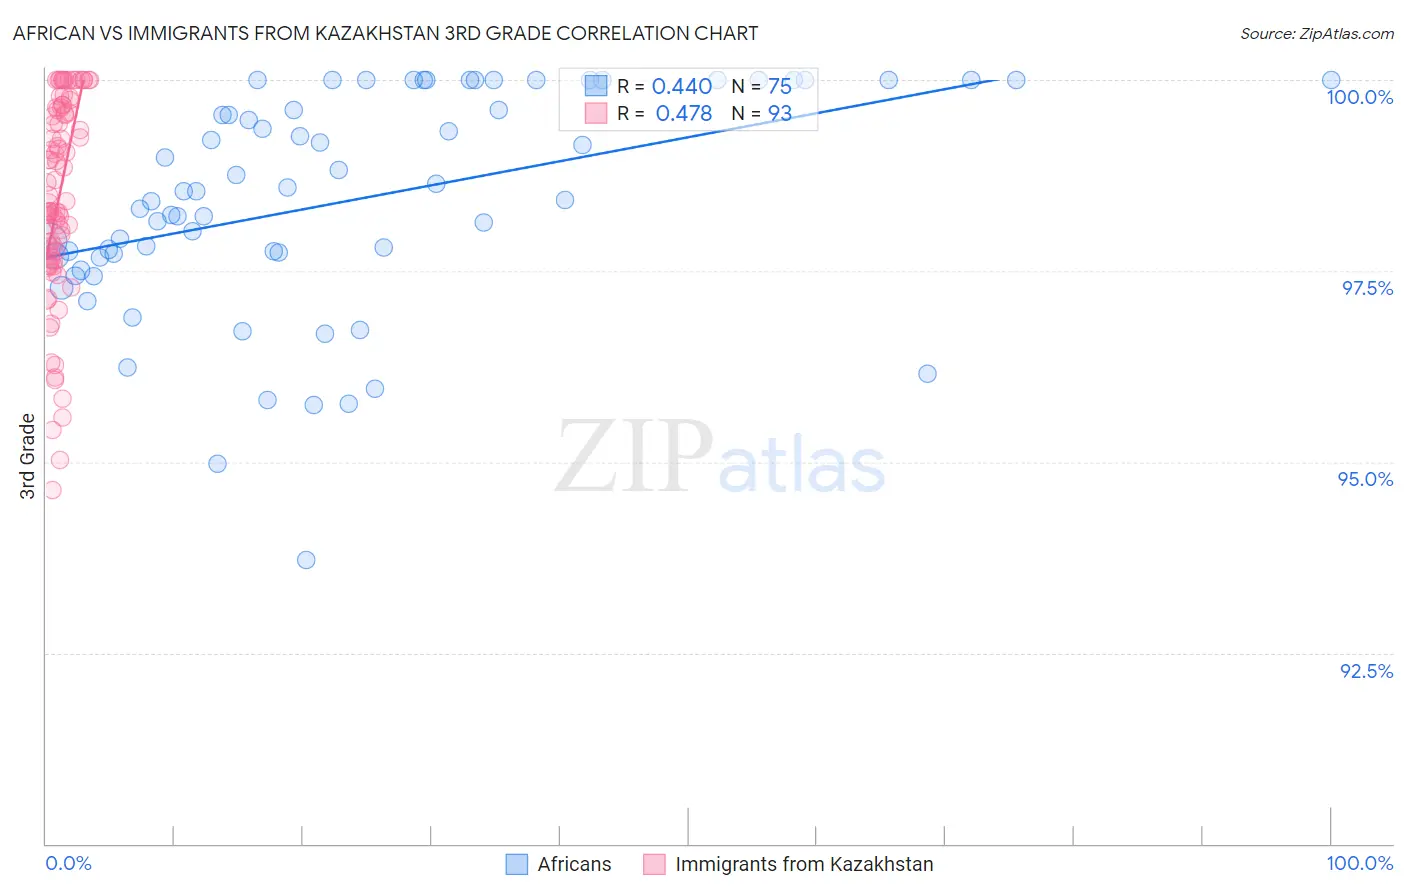
African vs Immigrants from Kazakhstan 3rd Grade Correlation Chart
The statistical analysis conducted on geographies consisting of 470,094,148 people shows a moderate positive correlation between the proportion of Africans and percentage of population with at least 3rd grade education in the United States with a correlation coefficient (R) of 0.440 and weighted average of 97.6%. Similarly, the statistical analysis conducted on geographies consisting of 124,444,388 people shows a moderate positive correlation between the proportion of Immigrants from Kazakhstan and percentage of population with at least 3rd grade education in the United States with a correlation coefficient (R) of 0.478 and weighted average of 97.7%, a difference of 0.11%.
3rd Grade Correlation Summary
| Measurement | African | Immigrants from Kazakhstan |
| Minimum | 93.7% | 94.6% |
| Maximum | 100.0% | 100.0% |
| Range | 6.3% | 5.4% |
| Mean | 98.4% | 98.5% |
| Median | 98.5% | 98.4% |
| Interquartile 25% (IQ1) | 97.7% | 97.7% |
| Interquartile 75% (IQ3) | 100.0% | 99.6% |
| Interquartile Range (IQR) | 2.3% | 1.9% |
| Standard Deviation (Sample) | 1.4% | 1.3% |
| Standard Deviation (Population) | 1.4% | 1.3% |
Similar Demographics by 3rd Grade
Demographics Similar to Africans by 3rd Grade
In terms of 3rd grade, the demographic groups most similar to Africans are Paiute (97.6%, a difference of 0.010%), Immigrants from Chile (97.6%, a difference of 0.010%), Immigrants from Northern Africa (97.6%, a difference of 0.010%), Tohono O'odham (97.6%, a difference of 0.010%), and Immigrants from Southern Europe (97.6%, a difference of 0.020%).
| Demographics | Rating | Rank | 3rd Grade |
| Guamanians/Chamorros | 23.6 /100 | #198 | Fair 97.7% |
| Immigrants | Ukraine | 22.7 /100 | #199 | Fair 97.7% |
| Immigrants | Albania | 22.6 /100 | #200 | Fair 97.7% |
| Immigrants | Lebanon | 21.7 /100 | #201 | Fair 97.7% |
| Immigrants | Southern Europe | 17.7 /100 | #202 | Poor 97.6% |
| Paiute | 16.7 /100 | #203 | Poor 97.6% |
| Immigrants | Chile | 16.5 /100 | #204 | Poor 97.6% |
| Africans | 14.5 /100 | #205 | Poor 97.6% |
| Immigrants | Northern Africa | 13.0 /100 | #206 | Poor 97.6% |
| Tohono O'odham | 12.5 /100 | #207 | Poor 97.6% |
| Immigrants | Zaire | 11.9 /100 | #208 | Poor 97.6% |
| Costa Ricans | 9.6 /100 | #209 | Tragic 97.6% |
| Immigrants | Oceania | 9.5 /100 | #210 | Tragic 97.6% |
| Laotians | 9.4 /100 | #211 | Tragic 97.6% |
| Immigrants | Bahamas | 8.5 /100 | #212 | Tragic 97.6% |
Demographics Similar to Immigrants from Kazakhstan by 3rd Grade
In terms of 3rd grade, the demographic groups most similar to Immigrants from Kazakhstan are Immigrants from Argentina (97.7%, a difference of 0.0%), Portuguese (97.7%, a difference of 0.0%), Arab (97.7%, a difference of 0.010%), Native/Alaskan (97.7%, a difference of 0.010%), and Immigrants from Taiwan (97.7%, a difference of 0.010%).
| Demographics | Rating | Rank | 3rd Grade |
| Egyptians | 46.6 /100 | #177 | Average 97.7% |
| Immigrants | Brazil | 46.4 /100 | #178 | Average 97.7% |
| Immigrants | Belarus | 45.9 /100 | #179 | Average 97.7% |
| Immigrants | Sri Lanka | 45.1 /100 | #180 | Average 97.7% |
| Immigrants | Venezuela | 44.4 /100 | #181 | Average 97.7% |
| Argentineans | 42.9 /100 | #182 | Average 97.7% |
| Arabs | 40.0 /100 | #183 | Fair 97.7% |
| Immigrants | Kazakhstan | 37.4 /100 | #184 | Fair 97.7% |
| Immigrants | Argentina | 37.0 /100 | #185 | Fair 97.7% |
| Portuguese | 36.2 /100 | #186 | Fair 97.7% |
| Natives/Alaskans | 35.2 /100 | #187 | Fair 97.7% |
| Immigrants | Taiwan | 34.2 /100 | #188 | Fair 97.7% |
| Pakistanis | 34.2 /100 | #189 | Fair 97.7% |
| Panamanians | 31.5 /100 | #190 | Fair 97.7% |
| Blacks/African Americans | 29.6 /100 | #191 | Fair 97.7% |