African vs Immigrants from Croatia Nursery School
COMPARE
African
Immigrants from Croatia
Nursery School
Nursery School Comparison
Africans
Immigrants from Croatia
97.9%
NURSERY SCHOOL
15.4/ 100
METRIC RATING
207th/ 347
METRIC RANK
98.2%
NURSERY SCHOOL
91.4/ 100
METRIC RATING
130th/ 347
METRIC RANK
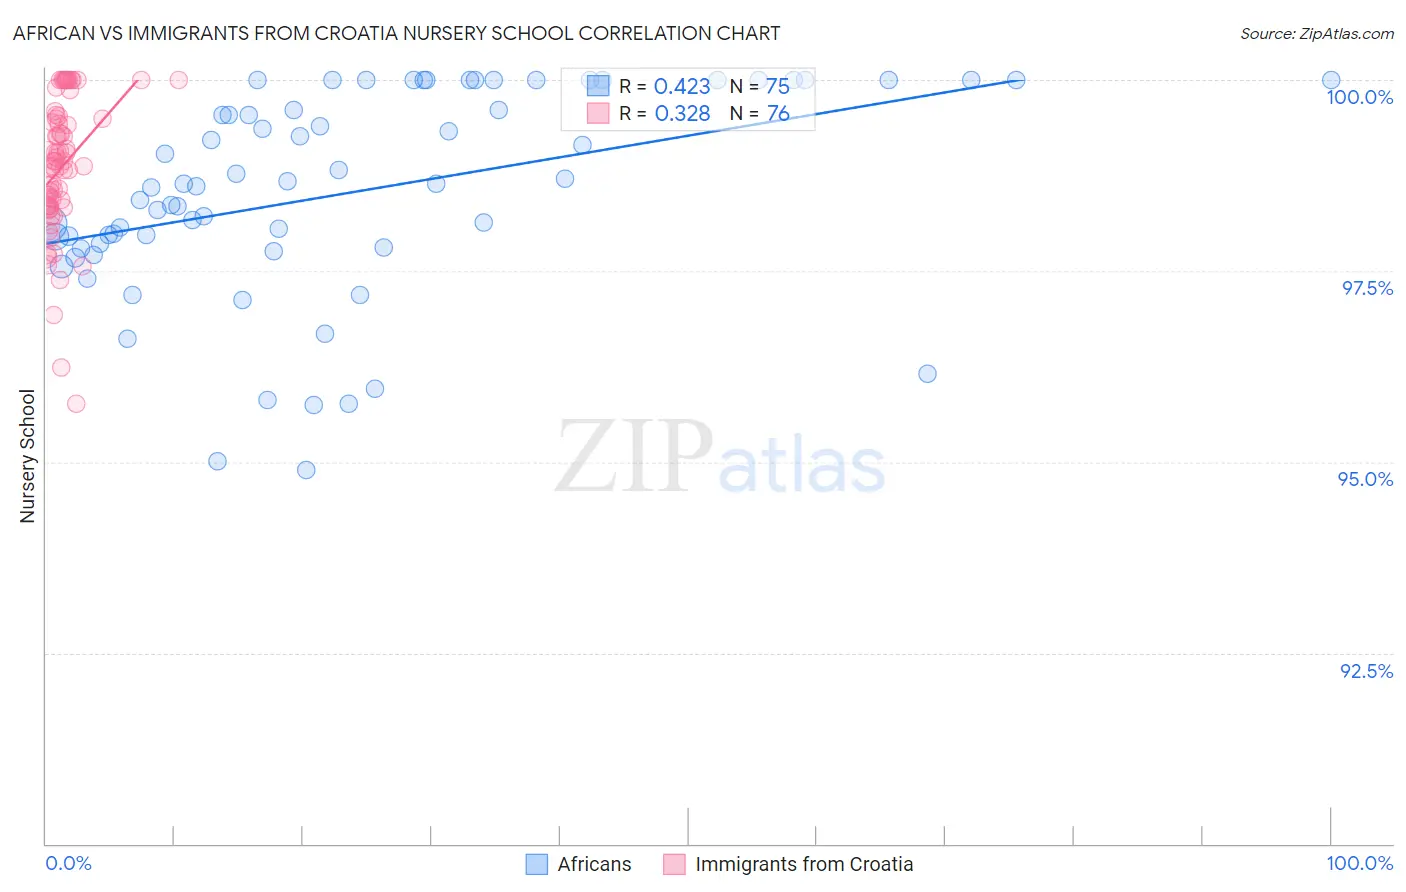
African vs Immigrants from Croatia Nursery School Correlation Chart
The statistical analysis conducted on geographies consisting of 470,094,148 people shows a moderate positive correlation between the proportion of Africans and percentage of population with at least nursery school education in the United States with a correlation coefficient (R) of 0.423 and weighted average of 97.9%. Similarly, the statistical analysis conducted on geographies consisting of 132,538,077 people shows a mild positive correlation between the proportion of Immigrants from Croatia and percentage of population with at least nursery school education in the United States with a correlation coefficient (R) of 0.328 and weighted average of 98.2%, a difference of 0.31%.
Nursery School Correlation Summary
| Measurement | African | Immigrants from Croatia |
| Minimum | 94.9% | 95.8% |
| Maximum | 100.0% | 100.0% |
| Range | 5.1% | 4.2% |
| Mean | 98.5% | 98.9% |
| Median | 98.6% | 98.9% |
| Interquartile 25% (IQ1) | 97.8% | 98.4% |
| Interquartile 75% (IQ3) | 100.0% | 99.5% |
| Interquartile Range (IQR) | 2.2% | 1.1% |
| Standard Deviation (Sample) | 1.3% | 0.89% |
| Standard Deviation (Population) | 1.3% | 0.88% |
Similar Demographics by Nursery School
Demographics Similar to Africans by Nursery School
In terms of nursery school, the demographic groups most similar to Africans are Immigrants from Uganda (97.9%, a difference of 0.010%), Immigrants from Southern Europe (97.9%, a difference of 0.010%), Immigrants from Chile (97.9%, a difference of 0.010%), Immigrants from Albania (97.9%, a difference of 0.010%), and Immigrants from Ukraine (97.9%, a difference of 0.020%).
| Demographics | Rating | Rank | Nursery School |
| Tohono O'odham | 22.2 /100 | #200 | Fair 97.9% |
| Immigrants | Lebanon | 21.2 /100 | #201 | Fair 97.9% |
| Immigrants | Ukraine | 19.9 /100 | #202 | Poor 97.9% |
| Immigrants | Uganda | 18.0 /100 | #203 | Poor 97.9% |
| Immigrants | Southern Europe | 17.4 /100 | #204 | Poor 97.9% |
| Immigrants | Chile | 17.3 /100 | #205 | Poor 97.9% |
| Immigrants | Albania | 16.4 /100 | #206 | Poor 97.9% |
| Africans | 15.4 /100 | #207 | Poor 97.9% |
| Immigrants | Northern Africa | 11.7 /100 | #208 | Poor 97.8% |
| Costa Ricans | 11.3 /100 | #209 | Poor 97.8% |
| Immigrants | Oceania | 10.2 /100 | #210 | Poor 97.8% |
| Laotians | 9.8 /100 | #211 | Tragic 97.8% |
| Immigrants | Bahamas | 8.6 /100 | #212 | Tragic 97.8% |
| Moroccans | 8.3 /100 | #213 | Tragic 97.8% |
| South American Indians | 8.0 /100 | #214 | Tragic 97.8% |
Demographics Similar to Immigrants from Croatia by Nursery School
In terms of nursery school, the demographic groups most similar to Immigrants from Croatia are Cambodian (98.2%, a difference of 0.0%), Spaniard (98.2%, a difference of 0.0%), Seminole (98.2%, a difference of 0.0%), Immigrants from Serbia (98.2%, a difference of 0.010%), and Immigrants from Europe (98.1%, a difference of 0.010%).
| Demographics | Rating | Rank | Nursery School |
| Syrians | 93.9 /100 | #123 | Exceptional 98.2% |
| Lebanese | 93.8 /100 | #124 | Exceptional 98.2% |
| Iroquois | 93.7 /100 | #125 | Exceptional 98.2% |
| Menominee | 93.6 /100 | #126 | Exceptional 98.2% |
| Immigrants | Saudi Arabia | 93.4 /100 | #127 | Exceptional 98.2% |
| Immigrants | Serbia | 92.4 /100 | #128 | Exceptional 98.2% |
| Cambodians | 91.4 /100 | #129 | Exceptional 98.2% |
| Immigrants | Croatia | 91.4 /100 | #130 | Exceptional 98.2% |
| Spaniards | 91.1 /100 | #131 | Exceptional 98.2% |
| Seminole | 90.9 /100 | #132 | Exceptional 98.2% |
| Immigrants | Europe | 90.7 /100 | #133 | Exceptional 98.1% |
| Immigrants | Bulgaria | 89.4 /100 | #134 | Excellent 98.1% |
| Immigrants | Hungary | 89.3 /100 | #135 | Excellent 98.1% |
| Immigrants | Kuwait | 88.9 /100 | #136 | Excellent 98.1% |
| Israelis | 88.2 /100 | #137 | Excellent 98.1% |