Afghan vs Lumbee 1st Grade
COMPARE
Afghan
Lumbee
1st Grade
1st Grade Comparison
Afghans
Lumbee
97.4%
1ST GRADE
0.1/ 100
METRIC RATING
280th/ 347
METRIC RANK
98.5%
1ST GRADE
99.9/ 100
METRIC RATING
43rd/ 347
METRIC RANK
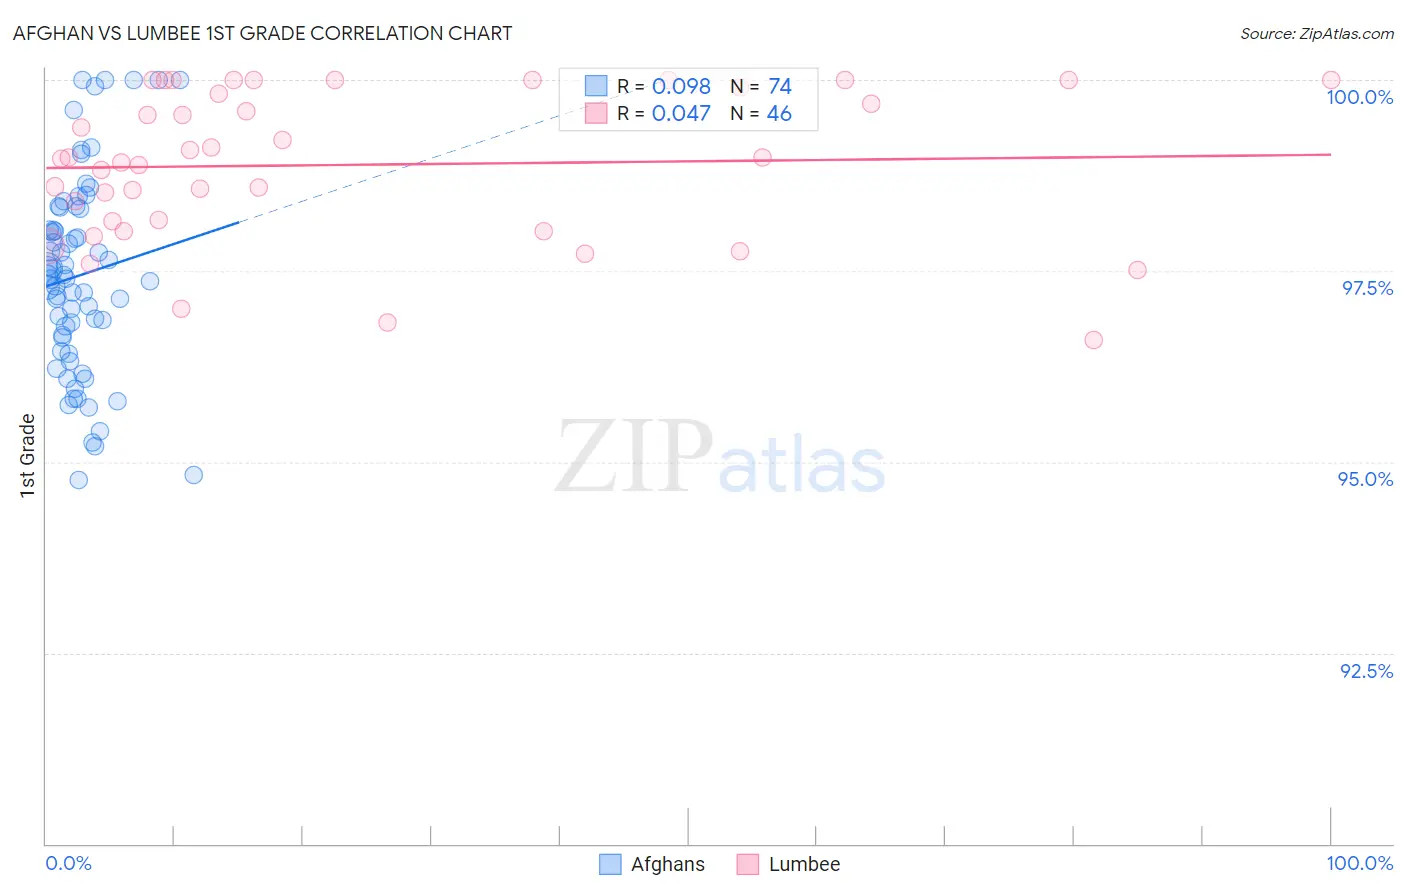
Afghan vs Lumbee 1st Grade Correlation Chart
The statistical analysis conducted on geographies consisting of 148,851,685 people shows a slight positive correlation between the proportion of Afghans and percentage of population with at least 1st grade education in the United States with a correlation coefficient (R) of 0.098 and weighted average of 97.4%. Similarly, the statistical analysis conducted on geographies consisting of 92,298,794 people shows no correlation between the proportion of Lumbee and percentage of population with at least 1st grade education in the United States with a correlation coefficient (R) of 0.047 and weighted average of 98.5%, a difference of 1.1%.
1st Grade Correlation Summary
| Measurement | Afghan | Lumbee |
| Minimum | 94.8% | 96.6% |
| Maximum | 100.0% | 100.0% |
| Range | 5.2% | 3.4% |
| Mean | 97.4% | 98.9% |
| Median | 97.4% | 99.0% |
| Interquartile 25% (IQ1) | 96.6% | 98.1% |
| Interquartile 75% (IQ3) | 98.3% | 99.9% |
| Interquartile Range (IQR) | 1.7% | 1.8% |
| Standard Deviation (Sample) | 1.3% | 0.97% |
| Standard Deviation (Population) | 1.3% | 0.96% |
Similar Demographics by 1st Grade
Demographics Similar to Afghans by 1st Grade
In terms of 1st grade, the demographic groups most similar to Afghans are Trinidadian and Tobagonian (97.3%, a difference of 0.0%), Barbadian (97.3%, a difference of 0.0%), Immigrants from Uzbekistan (97.4%, a difference of 0.010%), Immigrants from Ghana (97.4%, a difference of 0.010%), and Immigrants from Western Africa (97.4%, a difference of 0.030%).
| Demographics | Rating | Rank | 1st Grade |
| Immigrants | Bolivia | 0.2 /100 | #273 | Tragic 97.4% |
| Ghanaians | 0.1 /100 | #274 | Tragic 97.4% |
| Immigrants | China | 0.1 /100 | #275 | Tragic 97.4% |
| Immigrants | Philippines | 0.1 /100 | #276 | Tragic 97.4% |
| Immigrants | Western Africa | 0.1 /100 | #277 | Tragic 97.4% |
| Immigrants | Uzbekistan | 0.1 /100 | #278 | Tragic 97.4% |
| Immigrants | Ghana | 0.1 /100 | #279 | Tragic 97.4% |
| Afghans | 0.1 /100 | #280 | Tragic 97.4% |
| Trinidadians and Tobagonians | 0.1 /100 | #281 | Tragic 97.3% |
| Barbadians | 0.1 /100 | #282 | Tragic 97.3% |
| Immigrants | West Indies | 0.0 /100 | #283 | Tragic 97.3% |
| Immigrants | Trinidad and Tobago | 0.0 /100 | #284 | Tragic 97.3% |
| Immigrants | Portugal | 0.0 /100 | #285 | Tragic 97.3% |
| Immigrants | Barbados | 0.0 /100 | #286 | Tragic 97.3% |
| Immigrants | Hong Kong | 0.0 /100 | #287 | Tragic 97.3% |
Demographics Similar to Lumbee by 1st Grade
In terms of 1st grade, the demographic groups most similar to Lumbee are Native Hawaiian (98.5%, a difference of 0.0%), Northern European (98.5%, a difference of 0.0%), Luxembourger (98.5%, a difference of 0.010%), Eastern European (98.5%, a difference of 0.010%), and Belgian (98.4%, a difference of 0.010%).
| Demographics | Rating | Rank | 1st Grade |
| British | 100.0 /100 | #36 | Exceptional 98.5% |
| Italians | 99.9 /100 | #37 | Exceptional 98.5% |
| Chippewa | 99.9 /100 | #38 | Exceptional 98.5% |
| Latvians | 99.9 /100 | #39 | Exceptional 98.5% |
| Luxembourgers | 99.9 /100 | #40 | Exceptional 98.5% |
| Eastern Europeans | 99.9 /100 | #41 | Exceptional 98.5% |
| Native Hawaiians | 99.9 /100 | #42 | Exceptional 98.5% |
| Lumbee | 99.9 /100 | #43 | Exceptional 98.5% |
| Northern Europeans | 99.9 /100 | #44 | Exceptional 98.5% |
| Belgians | 99.9 /100 | #45 | Exceptional 98.4% |
| Hungarians | 99.9 /100 | #46 | Exceptional 98.4% |
| Ottawa | 99.8 /100 | #47 | Exceptional 98.4% |
| Czechoslovakians | 99.8 /100 | #48 | Exceptional 98.4% |
| Celtics | 99.8 /100 | #49 | Exceptional 98.4% |
| Whites/Caucasians | 99.8 /100 | #50 | Exceptional 98.4% |