Afghan vs Immigrants from Scotland No Schooling Completed
COMPARE
Afghan
Immigrants from Scotland
No Schooling Completed
No Schooling Completed Comparison
Afghans
Immigrants from Scotland
2.6%
NO SCHOOLING COMPLETED
0.1/ 100
METRIC RATING
281st/ 347
METRIC RANK
1.6%
NO SCHOOLING COMPLETED
99.9/ 100
METRIC RATING
48th/ 347
METRIC RANK
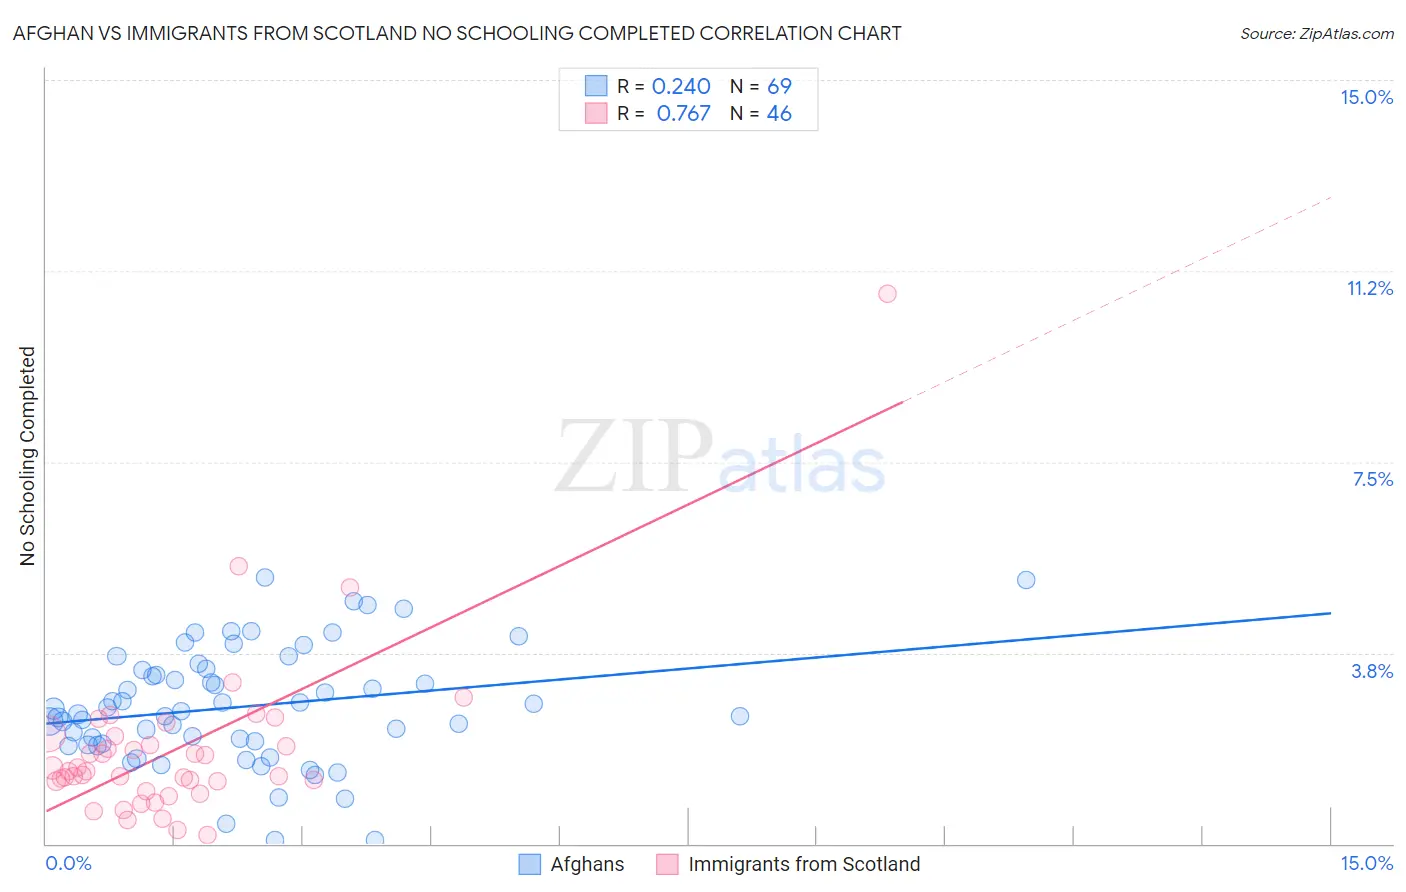
Afghan vs Immigrants from Scotland No Schooling Completed Correlation Chart
The statistical analysis conducted on geographies consisting of 148,452,178 people shows a weak positive correlation between the proportion of Afghans and percentage of population with no schooling in the United States with a correlation coefficient (R) of 0.240 and weighted average of 2.6%. Similarly, the statistical analysis conducted on geographies consisting of 195,168,886 people shows a strong positive correlation between the proportion of Immigrants from Scotland and percentage of population with no schooling in the United States with a correlation coefficient (R) of 0.767 and weighted average of 1.6%, a difference of 59.6%.
No Schooling Completed Correlation Summary
| Measurement | Afghan | Immigrants from Scotland |
| Minimum | 0.074% | 0.17% |
| Maximum | 5.2% | 10.8% |
| Range | 5.2% | 10.6% |
| Mean | 2.7% | 1.9% |
| Median | 2.6% | 1.4% |
| Interquartile 25% (IQ1) | 1.9% | 1.2% |
| Interquartile 75% (IQ3) | 3.4% | 2.1% |
| Interquartile Range (IQR) | 1.5% | 0.90% |
| Standard Deviation (Sample) | 1.1% | 1.7% |
| Standard Deviation (Population) | 1.1% | 1.7% |
Similar Demographics by No Schooling Completed
Demographics Similar to Afghans by No Schooling Completed
In terms of no schooling completed, the demographic groups most similar to Afghans are Trinidadian and Tobagonian (2.6%, a difference of 0.080%), Barbadian (2.6%, a difference of 0.10%), Immigrants from Ghana (2.6%, a difference of 0.20%), Immigrants from Uzbekistan (2.6%, a difference of 0.64%), and Immigrants from Philippines (2.6%, a difference of 0.84%).
| Demographics | Rating | Rank | No Schooling Completed |
| Ghanaians | 0.1 /100 | #274 | Tragic 2.6% |
| Immigrants | China | 0.1 /100 | #275 | Tragic 2.6% |
| Immigrants | Western Africa | 0.1 /100 | #276 | Tragic 2.6% |
| Immigrants | Philippines | 0.1 /100 | #277 | Tragic 2.6% |
| Immigrants | Uzbekistan | 0.1 /100 | #278 | Tragic 2.6% |
| Barbadians | 0.1 /100 | #279 | Tragic 2.6% |
| Trinidadians and Tobagonians | 0.1 /100 | #280 | Tragic 2.6% |
| Afghans | 0.1 /100 | #281 | Tragic 2.6% |
| Immigrants | Ghana | 0.1 /100 | #282 | Tragic 2.6% |
| Immigrants | Trinidad and Tobago | 0.0 /100 | #283 | Tragic 2.6% |
| Immigrants | West Indies | 0.0 /100 | #284 | Tragic 2.7% |
| Immigrants | Barbados | 0.0 /100 | #285 | Tragic 2.7% |
| Immigrants | Portugal | 0.0 /100 | #286 | Tragic 2.7% |
| Immigrants | Afghanistan | 0.0 /100 | #287 | Tragic 2.7% |
| Immigrants | St. Vincent and the Grenadines | 0.0 /100 | #288 | Tragic 2.7% |
Demographics Similar to Immigrants from Scotland by No Schooling Completed
In terms of no schooling completed, the demographic groups most similar to Immigrants from Scotland are White/Caucasian (1.6%, a difference of 0.060%), Celtic (1.6%, a difference of 0.19%), Ottawa (1.6%, a difference of 0.26%), Chippewa (1.6%, a difference of 0.39%), and Maltese (1.6%, a difference of 0.40%).
| Demographics | Rating | Rank | No Schooling Completed |
| Hungarians | 99.9 /100 | #41 | Exceptional 1.6% |
| Bulgarians | 99.9 /100 | #42 | Exceptional 1.6% |
| Australians | 99.9 /100 | #43 | Exceptional 1.6% |
| Estonians | 99.9 /100 | #44 | Exceptional 1.6% |
| Czechoslovakians | 99.9 /100 | #45 | Exceptional 1.6% |
| Maltese | 99.9 /100 | #46 | Exceptional 1.6% |
| Ottawa | 99.9 /100 | #47 | Exceptional 1.6% |
| Immigrants | Scotland | 99.9 /100 | #48 | Exceptional 1.6% |
| Whites/Caucasians | 99.9 /100 | #49 | Exceptional 1.6% |
| Celtics | 99.9 /100 | #50 | Exceptional 1.6% |
| Chippewa | 99.8 /100 | #51 | Exceptional 1.6% |
| Immigrants | Canada | 99.8 /100 | #52 | Exceptional 1.6% |
| Creek | 99.8 /100 | #53 | Exceptional 1.6% |
| Crow | 99.8 /100 | #54 | Exceptional 1.6% |
| Greeks | 99.8 /100 | #55 | Exceptional 1.6% |