Zimbabwean vs Portuguese Disability Age 35 to 64
COMPARE
Zimbabwean
Portuguese
Disability Age 35 to 64
Disability Age 35 to 64 Comparison
Zimbabweans
Portuguese
10.4%
DISABILITY AGE 35 TO 64
97.4/ 100
METRIC RATING
107th/ 347
METRIC RANK
11.9%
DISABILITY AGE 35 TO 64
4.9/ 100
METRIC RATING
234th/ 347
METRIC RANK
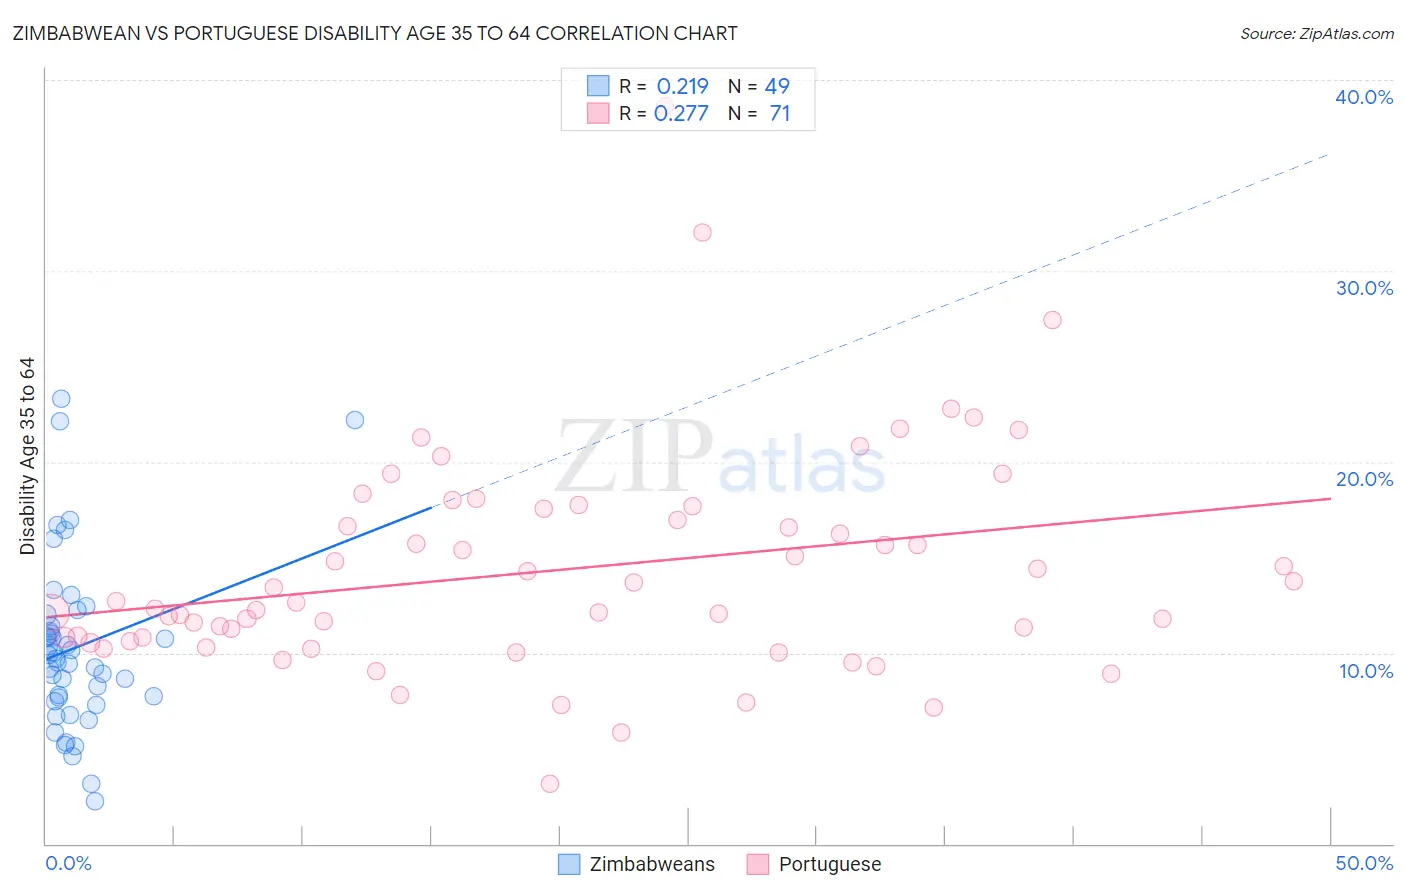
Zimbabwean vs Portuguese Disability Age 35 to 64 Correlation Chart
The statistical analysis conducted on geographies consisting of 69,187,609 people shows a weak positive correlation between the proportion of Zimbabweans and percentage of population with a disability between the ages 34 and 64 in the United States with a correlation coefficient (R) of 0.219 and weighted average of 10.4%. Similarly, the statistical analysis conducted on geographies consisting of 449,875,842 people shows a weak positive correlation between the proportion of Portuguese and percentage of population with a disability between the ages 34 and 64 in the United States with a correlation coefficient (R) of 0.277 and weighted average of 11.9%, a difference of 14.3%.
Disability Age 35 to 64 Correlation Summary
| Measurement | Zimbabwean | Portuguese |
| Minimum | 2.2% | 3.1% |
| Maximum | 23.3% | 38.6% |
| Range | 21.1% | 35.5% |
| Mean | 10.3% | 14.3% |
| Median | 9.7% | 12.7% |
| Interquartile 25% (IQ1) | 7.5% | 10.6% |
| Interquartile 75% (IQ3) | 11.7% | 17.6% |
| Interquartile Range (IQR) | 4.2% | 7.0% |
| Standard Deviation (Sample) | 4.5% | 5.8% |
| Standard Deviation (Population) | 4.5% | 5.8% |
Similar Demographics by Disability Age 35 to 64
Demographics Similar to Zimbabweans by Disability Age 35 to 64
In terms of disability age 35 to 64, the demographic groups most similar to Zimbabweans are Ethiopian (10.5%, a difference of 0.020%), Immigrants from Ethiopia (10.5%, a difference of 0.15%), Immigrants from Hungary (10.4%, a difference of 0.19%), Korean (10.5%, a difference of 0.22%), and Macedonian (10.4%, a difference of 0.34%).
| Demographics | Rating | Rank | Disability Age 35 to 64 |
| Immigrants | Jordan | 98.1 /100 | #100 | Exceptional 10.4% |
| Immigrants | Philippines | 98.0 /100 | #101 | Exceptional 10.4% |
| Immigrants | Western Asia | 98.0 /100 | #102 | Exceptional 10.4% |
| Immigrants | Ukraine | 97.9 /100 | #103 | Exceptional 10.4% |
| Immigrants | Austria | 97.8 /100 | #104 | Exceptional 10.4% |
| Macedonians | 97.8 /100 | #105 | Exceptional 10.4% |
| Immigrants | Hungary | 97.6 /100 | #106 | Exceptional 10.4% |
| Zimbabweans | 97.4 /100 | #107 | Exceptional 10.4% |
| Ethiopians | 97.4 /100 | #108 | Exceptional 10.5% |
| Immigrants | Ethiopia | 97.2 /100 | #109 | Exceptional 10.5% |
| Koreans | 97.1 /100 | #110 | Exceptional 10.5% |
| Brazilians | 96.9 /100 | #111 | Exceptional 10.5% |
| Assyrians/Chaldeans/Syriacs | 96.8 /100 | #112 | Exceptional 10.5% |
| Tongans | 96.6 /100 | #113 | Exceptional 10.5% |
| Immigrants | Morocco | 96.6 /100 | #114 | Exceptional 10.5% |
Demographics Similar to Portuguese by Disability Age 35 to 64
In terms of disability age 35 to 64, the demographic groups most similar to Portuguese are Bermudan (11.9%, a difference of 0.070%), Belizean (12.0%, a difference of 0.13%), Immigrants from Middle Africa (12.0%, a difference of 0.15%), Sudanese (11.9%, a difference of 0.18%), and Jamaican (11.9%, a difference of 0.32%).
| Demographics | Rating | Rank | Disability Age 35 to 64 |
| Immigrants | Central America | 6.3 /100 | #227 | Tragic 11.9% |
| Immigrants | Germany | 6.2 /100 | #228 | Tragic 11.9% |
| British West Indians | 6.1 /100 | #229 | Tragic 11.9% |
| Panamanians | 5.8 /100 | #230 | Tragic 11.9% |
| Jamaicans | 5.7 /100 | #231 | Tragic 11.9% |
| Sudanese | 5.3 /100 | #232 | Tragic 11.9% |
| Bermudans | 5.0 /100 | #233 | Tragic 11.9% |
| Portuguese | 4.9 /100 | #234 | Tragic 11.9% |
| Belizeans | 4.5 /100 | #235 | Tragic 12.0% |
| Immigrants | Middle Africa | 4.5 /100 | #236 | Tragic 12.0% |
| Immigrants | Cambodia | 3.9 /100 | #237 | Tragic 12.0% |
| West Indians | 3.7 /100 | #238 | Tragic 12.0% |
| Immigrants | Western Africa | 3.3 /100 | #239 | Tragic 12.0% |
| Immigrants | Thailand | 3.3 /100 | #240 | Tragic 12.0% |
| Mexican American Indians | 3.2 /100 | #241 | Tragic 12.0% |