Zimbabwean vs Immigrants from Russia Disability Age Over 75
COMPARE
Zimbabwean
Immigrants from Russia
Disability Age Over 75
Disability Age Over 75 Comparison
Zimbabweans
Immigrants from Russia
48.1%
DISABILITY AGE OVER 75
6.4/ 100
METRIC RATING
227th/ 347
METRIC RANK
47.0%
DISABILITY AGE OVER 75
79.3/ 100
METRIC RATING
150th/ 347
METRIC RANK
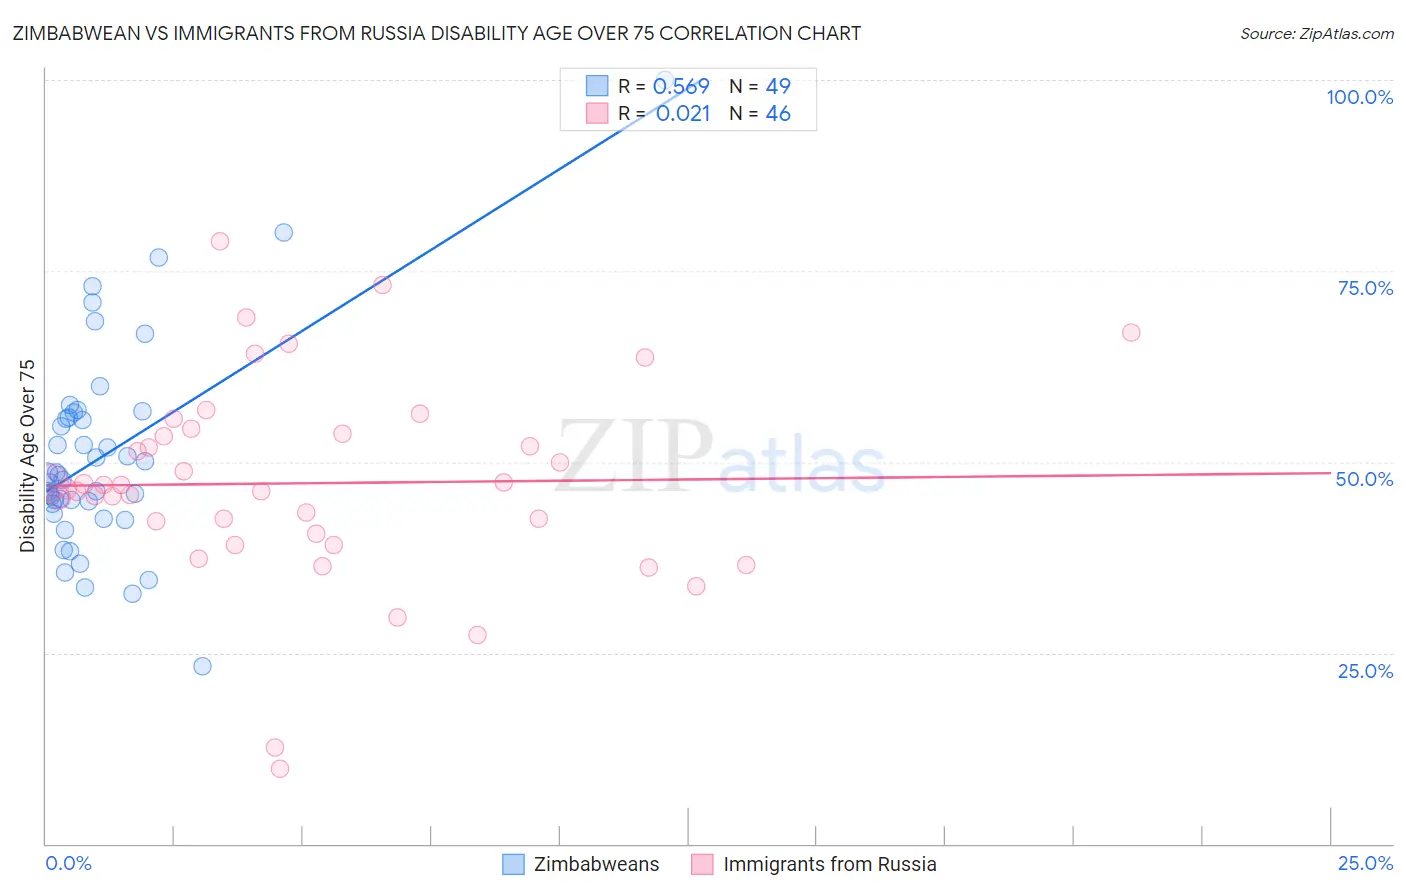
Zimbabwean vs Immigrants from Russia Disability Age Over 75 Correlation Chart
The statistical analysis conducted on geographies consisting of 69,112,406 people shows a substantial positive correlation between the proportion of Zimbabweans and percentage of population with a disability over the age of 75 in the United States with a correlation coefficient (R) of 0.569 and weighted average of 48.1%. Similarly, the statistical analysis conducted on geographies consisting of 347,296,356 people shows no correlation between the proportion of Immigrants from Russia and percentage of population with a disability over the age of 75 in the United States with a correlation coefficient (R) of 0.021 and weighted average of 47.0%, a difference of 2.3%.
Disability Age Over 75 Correlation Summary
| Measurement | Zimbabwean | Immigrants from Russia |
| Minimum | 23.2% | 9.8% |
| Maximum | 100.0% | 78.9% |
| Range | 76.8% | 69.1% |
| Mean | 50.8% | 47.2% |
| Median | 48.2% | 46.7% |
| Interquartile 25% (IQ1) | 43.9% | 40.6% |
| Interquartile 75% (IQ3) | 56.1% | 53.7% |
| Interquartile Range (IQR) | 12.3% | 13.0% |
| Standard Deviation (Sample) | 13.5% | 13.4% |
| Standard Deviation (Population) | 13.4% | 13.3% |
Similar Demographics by Disability Age Over 75
Demographics Similar to Zimbabweans by Disability Age Over 75
In terms of disability age over 75, the demographic groups most similar to Zimbabweans are Spanish (48.0%, a difference of 0.010%), Nonimmigrants (48.0%, a difference of 0.010%), Liberian (48.0%, a difference of 0.020%), Immigrants from Bangladesh (48.0%, a difference of 0.030%), and Barbadian (48.0%, a difference of 0.040%).
| Demographics | Rating | Rank | Disability Age Over 75 |
| Bahamians | 7.4 /100 | #220 | Tragic 48.0% |
| Immigrants | Oceania | 7.3 /100 | #221 | Tragic 48.0% |
| Barbadians | 6.8 /100 | #222 | Tragic 48.0% |
| Immigrants | Bangladesh | 6.8 /100 | #223 | Tragic 48.0% |
| Liberians | 6.7 /100 | #224 | Tragic 48.0% |
| Spanish | 6.5 /100 | #225 | Tragic 48.0% |
| Immigrants | Nonimmigrants | 6.5 /100 | #226 | Tragic 48.0% |
| Zimbabweans | 6.4 /100 | #227 | Tragic 48.1% |
| Immigrants | Liberia | 5.9 /100 | #228 | Tragic 48.1% |
| Spaniards | 5.7 /100 | #229 | Tragic 48.1% |
| Taiwanese | 4.4 /100 | #230 | Tragic 48.2% |
| Immigrants | Immigrants | 4.3 /100 | #231 | Tragic 48.2% |
| Indonesians | 4.2 /100 | #232 | Tragic 48.2% |
| Cree | 4.2 /100 | #233 | Tragic 48.2% |
| Sub-Saharan Africans | 3.8 /100 | #234 | Tragic 48.2% |
Demographics Similar to Immigrants from Russia by Disability Age Over 75
In terms of disability age over 75, the demographic groups most similar to Immigrants from Russia are French Canadian (47.0%, a difference of 0.010%), Welsh (47.0%, a difference of 0.070%), Asian (46.9%, a difference of 0.080%), Immigrants from Asia (47.0%, a difference of 0.090%), and Immigrants from Zaire (47.1%, a difference of 0.14%).
| Demographics | Rating | Rank | Disability Age Over 75 |
| Bermudans | 85.6 /100 | #143 | Excellent 46.9% |
| Venezuelans | 85.0 /100 | #144 | Excellent 46.9% |
| Costa Ricans | 84.5 /100 | #145 | Excellent 46.9% |
| Guyanese | 84.3 /100 | #146 | Excellent 46.9% |
| Immigrants | Peru | 84.1 /100 | #147 | Excellent 46.9% |
| Asians | 81.6 /100 | #148 | Excellent 46.9% |
| Welsh | 81.3 /100 | #149 | Excellent 47.0% |
| Immigrants | Russia | 79.3 /100 | #150 | Good 47.0% |
| French Canadians | 79.0 /100 | #151 | Good 47.0% |
| Immigrants | Asia | 76.5 /100 | #152 | Good 47.0% |
| Immigrants | Zaire | 74.8 /100 | #153 | Good 47.1% |
| Immigrants | Belarus | 74.8 /100 | #154 | Good 47.1% |
| Immigrants | Iran | 74.7 /100 | #155 | Good 47.1% |
| Arabs | 73.3 /100 | #156 | Good 47.1% |
| Bhutanese | 72.6 /100 | #157 | Good 47.1% |