Yaqui vs Immigrants from Fiji Disability Age Over 75
COMPARE
Yaqui
Immigrants from Fiji
Disability Age Over 75
Disability Age Over 75 Comparison
Yaqui
Immigrants from Fiji
49.8%
DISABILITY AGE OVER 75
0.0/ 100
METRIC RATING
288th/ 347
METRIC RANK
50.6%
DISABILITY AGE OVER 75
0.0/ 100
METRIC RATING
307th/ 347
METRIC RANK
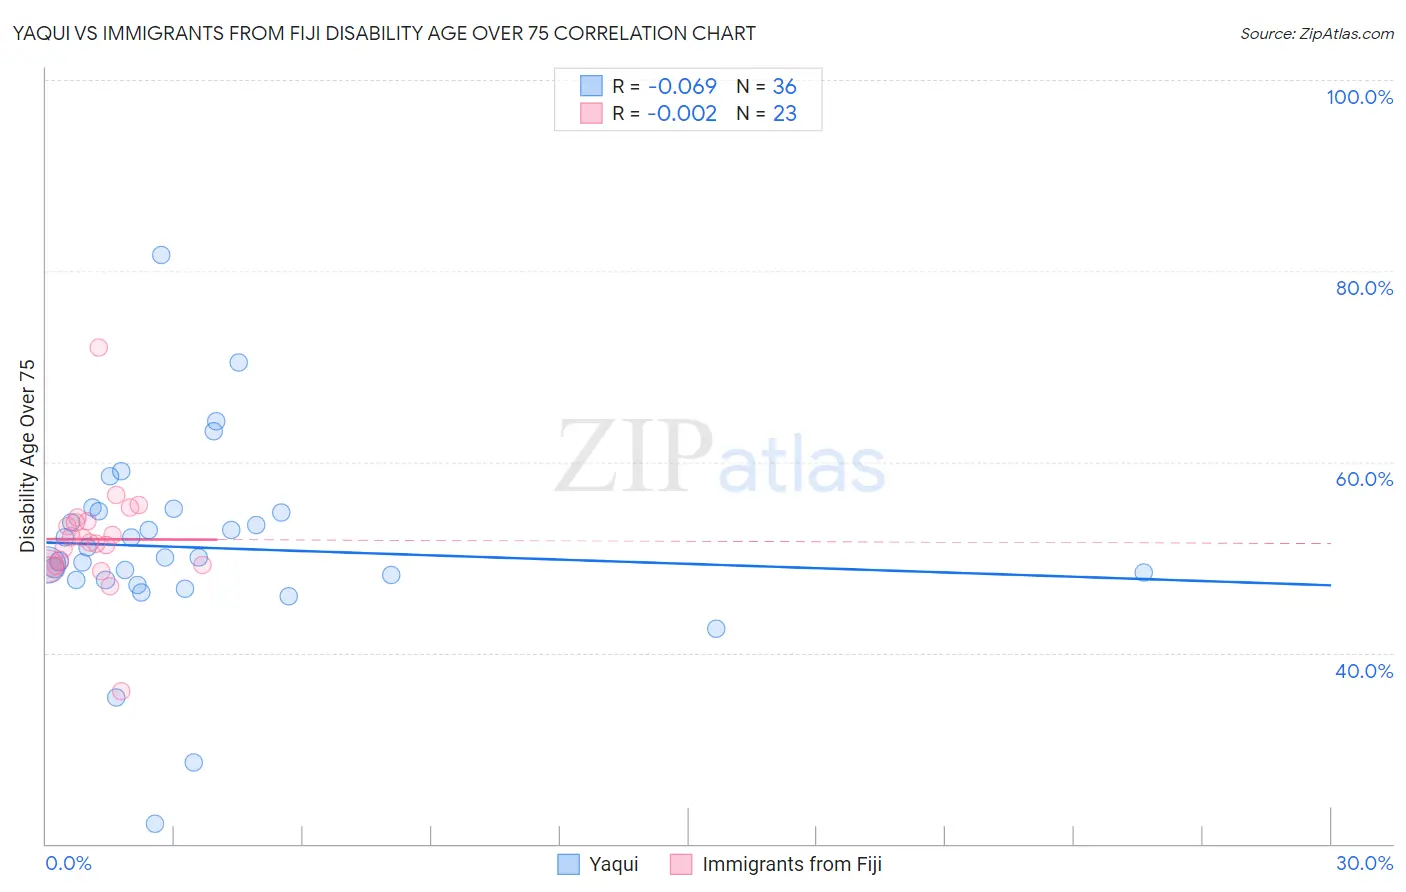
Yaqui vs Immigrants from Fiji Disability Age Over 75 Correlation Chart
The statistical analysis conducted on geographies consisting of 107,650,566 people shows a slight negative correlation between the proportion of Yaqui and percentage of population with a disability over the age of 75 in the United States with a correlation coefficient (R) of -0.069 and weighted average of 49.8%. Similarly, the statistical analysis conducted on geographies consisting of 93,724,522 people shows no correlation between the proportion of Immigrants from Fiji and percentage of population with a disability over the age of 75 in the United States with a correlation coefficient (R) of -0.002 and weighted average of 50.6%, a difference of 1.6%.
Disability Age Over 75 Correlation Summary
| Measurement | Yaqui | Immigrants from Fiji |
| Minimum | 22.1% | 35.9% |
| Maximum | 81.7% | 72.0% |
| Range | 59.5% | 36.1% |
| Mean | 51.0% | 51.9% |
| Median | 50.0% | 51.5% |
| Interquartile 25% (IQ1) | 47.6% | 49.1% |
| Interquartile 75% (IQ3) | 54.8% | 53.8% |
| Interquartile Range (IQR) | 7.1% | 4.7% |
| Standard Deviation (Sample) | 10.2% | 6.0% |
| Standard Deviation (Population) | 10.1% | 5.9% |
Demographics Similar to Yaqui and Immigrants from Fiji by Disability Age Over 75
In terms of disability age over 75, the demographic groups most similar to Yaqui are Sioux (49.7%, a difference of 0.050%), Osage (49.8%, a difference of 0.080%), Puget Sound Salish (49.8%, a difference of 0.090%), Arapaho (49.8%, a difference of 0.090%), and Shoshone (49.9%, a difference of 0.16%). Similarly, the demographic groups most similar to Immigrants from Fiji are Immigrants from Central America (50.5%, a difference of 0.060%), Central American Indian (50.5%, a difference of 0.15%), Immigrants from Dominican Republic (50.3%, a difference of 0.56%), Japanese (50.2%, a difference of 0.67%), and Cherokee (50.2%, a difference of 0.68%).
| Demographics | Rating | Rank | Disability Age Over 75 |
| Sioux | 0.0 /100 | #287 | Tragic 49.7% |
| Yaqui | 0.0 /100 | #288 | Tragic 49.8% |
| Osage | 0.0 /100 | #289 | Tragic 49.8% |
| Puget Sound Salish | 0.0 /100 | #290 | Tragic 49.8% |
| Arapaho | 0.0 /100 | #291 | Tragic 49.8% |
| Shoshone | 0.0 /100 | #292 | Tragic 49.9% |
| Spanish American Indians | 0.0 /100 | #293 | Tragic 49.9% |
| Immigrants | Cambodia | 0.0 /100 | #294 | Tragic 50.0% |
| Spanish Americans | 0.0 /100 | #295 | Tragic 50.0% |
| Mexican American Indians | 0.0 /100 | #296 | Tragic 50.0% |
| Armenians | 0.0 /100 | #297 | Tragic 50.0% |
| Marshallese | 0.0 /100 | #298 | Tragic 50.1% |
| Immigrants | Micronesia | 0.0 /100 | #299 | Tragic 50.1% |
| Cape Verdeans | 0.0 /100 | #300 | Tragic 50.1% |
| Dominicans | 0.0 /100 | #301 | Tragic 50.2% |
| Cherokee | 0.0 /100 | #302 | Tragic 50.2% |
| Japanese | 0.0 /100 | #303 | Tragic 50.2% |
| Immigrants | Dominican Republic | 0.0 /100 | #304 | Tragic 50.3% |
| Central American Indians | 0.0 /100 | #305 | Tragic 50.5% |
| Immigrants | Central America | 0.0 /100 | #306 | Tragic 50.5% |
| Immigrants | Fiji | 0.0 /100 | #307 | Tragic 50.6% |