Yakama vs Immigrants from Uzbekistan Disability Age 65 to 74
COMPARE
Yakama
Immigrants from Uzbekistan
Disability Age 65 to 74
Disability Age 65 to 74 Comparison
Yakama
Immigrants from Uzbekistan
29.6%
DISABILITY AGE 65 TO 74
0.0/ 100
METRIC RATING
326th/ 347
METRIC RANK
22.8%
DISABILITY AGE 65 TO 74
83.1/ 100
METRIC RATING
147th/ 347
METRIC RANK
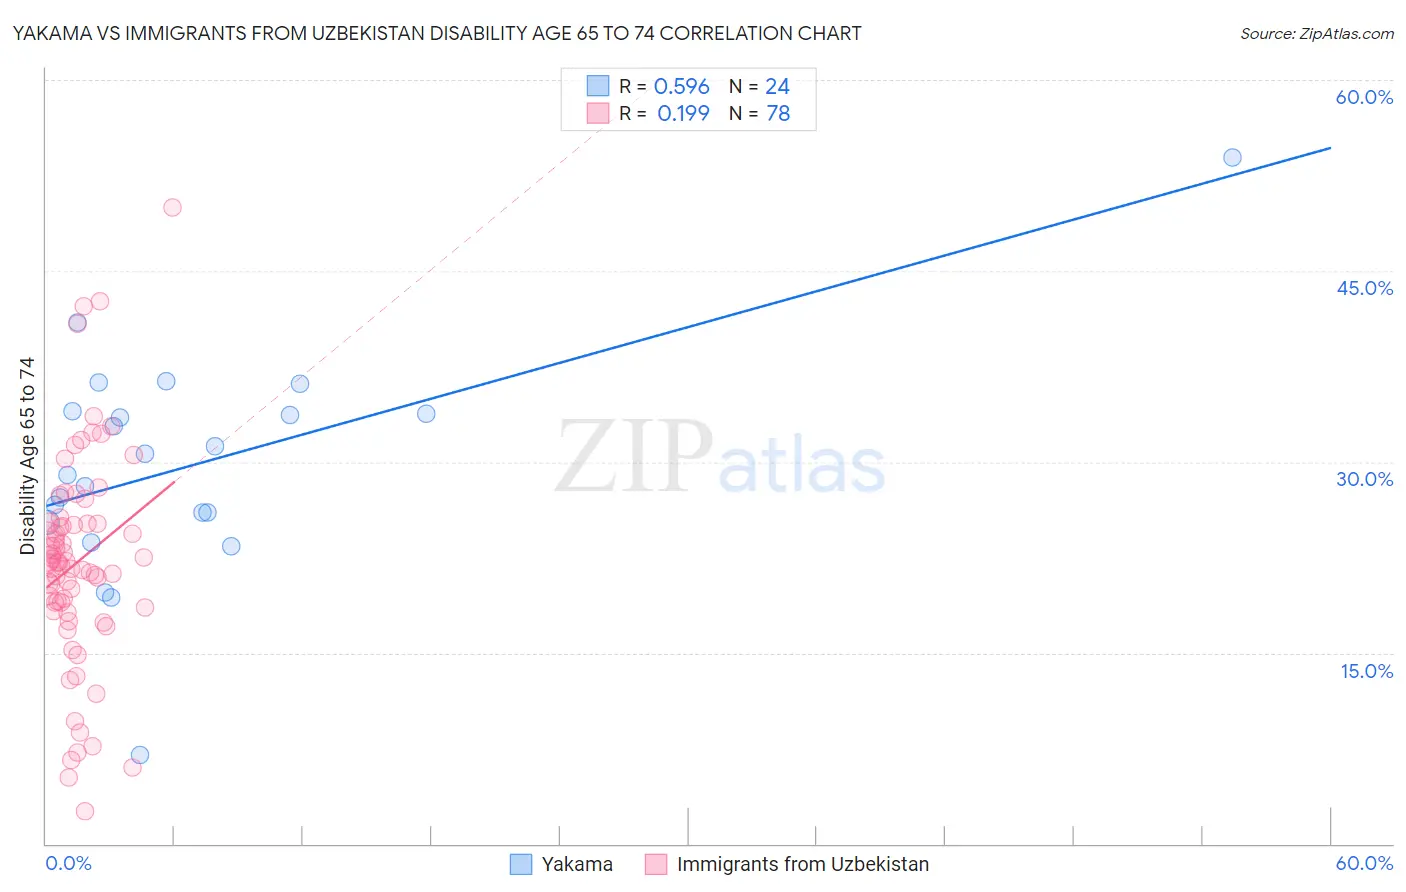
Yakama vs Immigrants from Uzbekistan Disability Age 65 to 74 Correlation Chart
The statistical analysis conducted on geographies consisting of 19,894,634 people shows a substantial positive correlation between the proportion of Yakama and percentage of population with a disability between the ages 65 and 75 in the United States with a correlation coefficient (R) of 0.596 and weighted average of 29.6%. Similarly, the statistical analysis conducted on geographies consisting of 118,581,209 people shows a poor positive correlation between the proportion of Immigrants from Uzbekistan and percentage of population with a disability between the ages 65 and 75 in the United States with a correlation coefficient (R) of 0.199 and weighted average of 22.8%, a difference of 29.9%.
Disability Age 65 to 74 Correlation Summary
| Measurement | Yakama | Immigrants from Uzbekistan |
| Minimum | 7.0% | 2.6% |
| Maximum | 54.0% | 50.0% |
| Range | 47.0% | 47.4% |
| Mean | 29.8% | 22.1% |
| Median | 29.8% | 22.0% |
| Interquartile 25% (IQ1) | 25.6% | 18.6% |
| Interquartile 75% (IQ3) | 33.9% | 25.2% |
| Interquartile Range (IQR) | 8.3% | 6.6% |
| Standard Deviation (Sample) | 8.8% | 8.4% |
| Standard Deviation (Population) | 8.6% | 8.4% |
Similar Demographics by Disability Age 65 to 74
Demographics Similar to Yakama by Disability Age 65 to 74
In terms of disability age 65 to 74, the demographic groups most similar to Yakama are Apache (29.7%, a difference of 0.16%), Dutch West Indian (29.6%, a difference of 0.23%), Seminole (29.4%, a difference of 0.68%), Hopi (30.0%, a difference of 1.1%), and Puerto Rican (29.1%, a difference of 1.7%).
| Demographics | Rating | Rank | Disability Age 65 to 74 |
| Arapaho | 0.0 /100 | #319 | Tragic 28.1% |
| Cherokee | 0.0 /100 | #320 | Tragic 28.2% |
| Comanche | 0.0 /100 | #321 | Tragic 28.3% |
| Aleuts | 0.0 /100 | #322 | Tragic 28.4% |
| Puerto Ricans | 0.0 /100 | #323 | Tragic 29.1% |
| Seminole | 0.0 /100 | #324 | Tragic 29.4% |
| Dutch West Indians | 0.0 /100 | #325 | Tragic 29.6% |
| Yakama | 0.0 /100 | #326 | Tragic 29.6% |
| Apache | 0.0 /100 | #327 | Tragic 29.7% |
| Hopi | 0.0 /100 | #328 | Tragic 30.0% |
| Choctaw | 0.0 /100 | #329 | Tragic 30.2% |
| Creek | 0.0 /100 | #330 | Tragic 30.2% |
| Chickasaw | 0.0 /100 | #331 | Tragic 30.2% |
| Natives/Alaskans | 0.0 /100 | #332 | Tragic 30.4% |
| Colville | 0.0 /100 | #333 | Tragic 30.5% |
Demographics Similar to Immigrants from Uzbekistan by Disability Age 65 to 74
In terms of disability age 65 to 74, the demographic groups most similar to Immigrants from Uzbekistan are Alsatian (22.8%, a difference of 0.070%), Immigrants from Uganda (22.8%, a difference of 0.10%), Danish (22.8%, a difference of 0.14%), Arab (22.8%, a difference of 0.19%), and Immigrants from Ethiopia (22.7%, a difference of 0.25%).
| Demographics | Rating | Rank | Disability Age 65 to 74 |
| Ugandans | 85.4 /100 | #140 | Excellent 22.7% |
| Belgians | 85.3 /100 | #141 | Excellent 22.7% |
| Immigrants | Ethiopia | 85.3 /100 | #142 | Excellent 22.7% |
| Arabs | 84.8 /100 | #143 | Excellent 22.8% |
| Danes | 84.4 /100 | #144 | Excellent 22.8% |
| Immigrants | Uganda | 84.0 /100 | #145 | Excellent 22.8% |
| Alsatians | 83.7 /100 | #146 | Excellent 22.8% |
| Immigrants | Uzbekistan | 83.1 /100 | #147 | Excellent 22.8% |
| New Zealanders | 79.9 /100 | #148 | Good 22.9% |
| Swiss | 79.7 /100 | #149 | Good 22.9% |
| Canadians | 77.7 /100 | #150 | Good 22.9% |
| Immigrants | Morocco | 77.6 /100 | #151 | Good 22.9% |
| Finns | 76.5 /100 | #152 | Good 22.9% |
| Slavs | 75.2 /100 | #153 | Good 23.0% |
| Sri Lankans | 74.0 /100 | #154 | Good 23.0% |