Welsh vs Immigrants from Belarus Disability
COMPARE
Welsh
Immigrants from Belarus
Disability
Disability Comparison
Welsh
Immigrants from Belarus
12.9%
DISABILITY
0.0/ 100
METRIC RATING
284th/ 347
METRIC RANK
11.1%
DISABILITY
98.9/ 100
METRIC RATING
85th/ 347
METRIC RANK
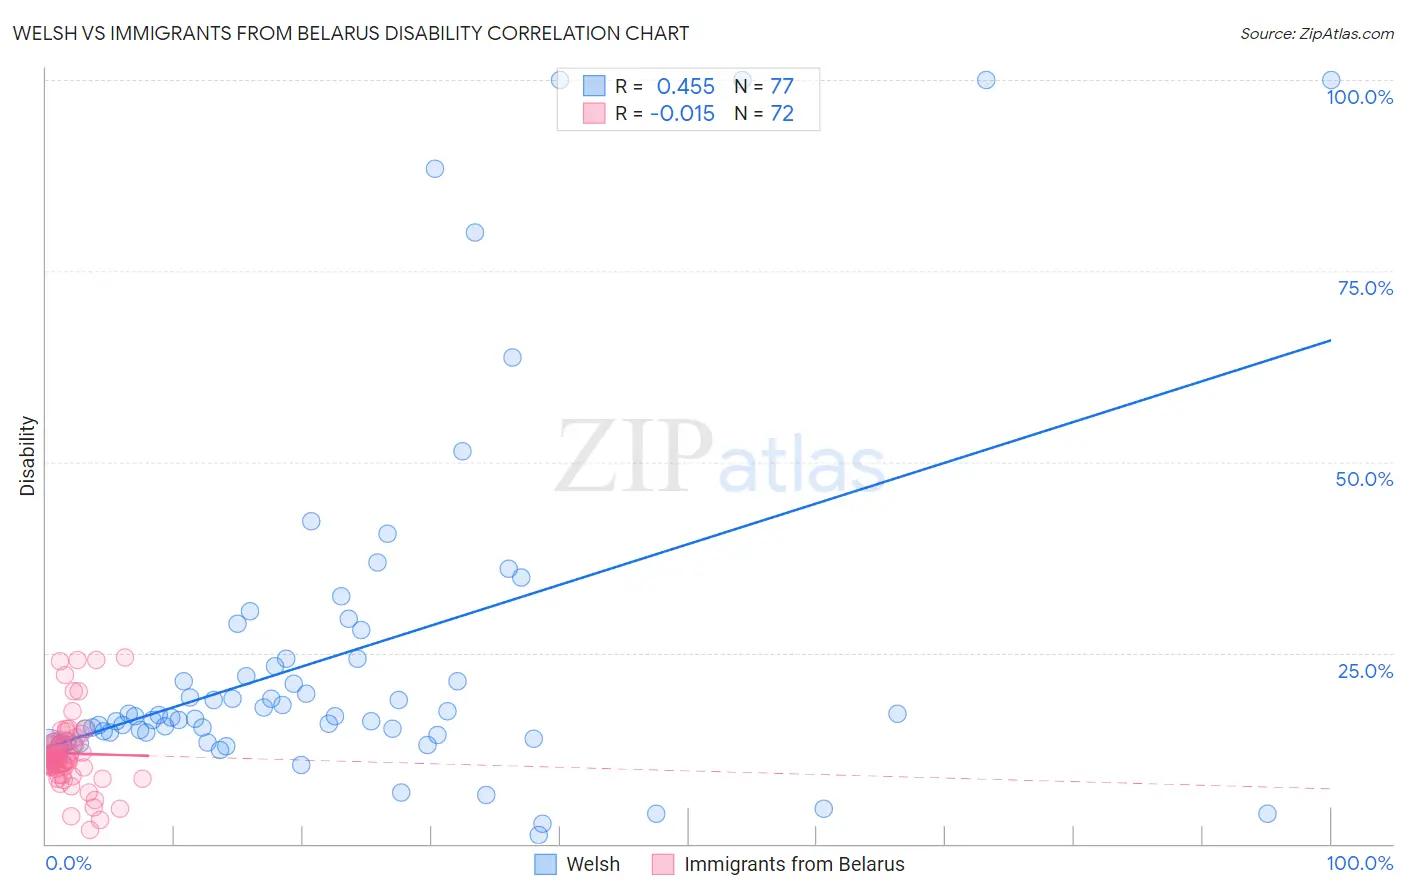
Welsh vs Immigrants from Belarus Disability Correlation Chart
The statistical analysis conducted on geographies consisting of 528,530,777 people shows a moderate positive correlation between the proportion of Welsh and percentage of population with a disability in the United States with a correlation coefficient (R) of 0.455 and weighted average of 12.9%. Similarly, the statistical analysis conducted on geographies consisting of 150,193,731 people shows no correlation between the proportion of Immigrants from Belarus and percentage of population with a disability in the United States with a correlation coefficient (R) of -0.015 and weighted average of 11.1%, a difference of 16.1%.
Disability Correlation Summary
| Measurement | Welsh | Immigrants from Belarus |
| Minimum | 1.2% | 1.8% |
| Maximum | 100.0% | 24.3% |
| Range | 98.8% | 22.6% |
| Mean | 24.8% | 11.8% |
| Median | 16.7% | 11.0% |
| Interquartile 25% (IQ1) | 14.0% | 10.0% |
| Interquartile 75% (IQ3) | 24.2% | 13.2% |
| Interquartile Range (IQR) | 10.1% | 3.2% |
| Standard Deviation (Sample) | 23.0% | 4.6% |
| Standard Deviation (Population) | 22.8% | 4.6% |
Similar Demographics by Disability
Demographics Similar to Welsh by Disability
In terms of disability, the demographic groups most similar to Welsh are Crow (12.9%, a difference of 0.010%), Irish (12.9%, a difference of 0.19%), Scottish (12.9%, a difference of 0.22%), Immigrants from Portugal (12.9%, a difference of 0.36%), and English (13.0%, a difference of 0.39%).
| Demographics | Rating | Rank | Disability |
| Dutch | 0.0 /100 | #277 | Tragic 12.8% |
| Germans | 0.0 /100 | #278 | Tragic 12.8% |
| Fijians | 0.0 /100 | #279 | Tragic 12.8% |
| Spanish | 0.0 /100 | #280 | Tragic 12.8% |
| Immigrants | Portugal | 0.0 /100 | #281 | Tragic 12.9% |
| Scottish | 0.0 /100 | #282 | Tragic 12.9% |
| Irish | 0.0 /100 | #283 | Tragic 12.9% |
| Welsh | 0.0 /100 | #284 | Tragic 12.9% |
| Crow | 0.0 /100 | #285 | Tragic 12.9% |
| English | 0.0 /100 | #286 | Tragic 13.0% |
| Africans | 0.0 /100 | #287 | Tragic 13.0% |
| Whites/Caucasians | 0.0 /100 | #288 | Tragic 13.0% |
| Slovaks | 0.0 /100 | #289 | Tragic 13.0% |
| Cheyenne | 0.0 /100 | #290 | Tragic 13.0% |
| Yaqui | 0.0 /100 | #291 | Tragic 13.1% |
Demographics Similar to Immigrants from Belarus by Disability
In terms of disability, the demographic groups most similar to Immigrants from Belarus are Immigrants from Russia (11.1%, a difference of 0.0%), Palestinian (11.1%, a difference of 0.040%), Immigrants from Sierra Leone (11.1%, a difference of 0.15%), Immigrants from Switzerland (11.1%, a difference of 0.16%), and Chilean (11.1%, a difference of 0.19%).
| Demographics | Rating | Rank | Disability |
| Immigrants | Cameroon | 99.3 /100 | #78 | Exceptional 11.1% |
| Immigrants | Jordan | 99.3 /100 | #79 | Exceptional 11.1% |
| Immigrants | Ireland | 99.3 /100 | #80 | Exceptional 11.1% |
| Immigrants | Poland | 99.1 /100 | #81 | Exceptional 11.1% |
| Chileans | 99.1 /100 | #82 | Exceptional 11.1% |
| Immigrants | Switzerland | 99.0 /100 | #83 | Exceptional 11.1% |
| Immigrants | Sierra Leone | 99.0 /100 | #84 | Exceptional 11.1% |
| Immigrants | Belarus | 98.9 /100 | #85 | Exceptional 11.1% |
| Immigrants | Russia | 98.9 /100 | #86 | Exceptional 11.1% |
| Palestinians | 98.9 /100 | #87 | Exceptional 11.1% |
| Immigrants | Romania | 98.5 /100 | #88 | Exceptional 11.2% |
| Immigrants | South Africa | 98.2 /100 | #89 | Exceptional 11.2% |
| Immigrants | Brazil | 98.1 /100 | #90 | Exceptional 11.2% |
| Immigrants | Western Asia | 98.1 /100 | #91 | Exceptional 11.2% |
| Ecuadorians | 98.0 /100 | #92 | Exceptional 11.2% |