U.S. Virgin Islander vs Scandinavian Disability Age 65 to 74
COMPARE
U.S. Virgin Islander
Scandinavian
Disability Age 65 to 74
Disability Age 65 to 74 Comparison
U.S. Virgin Islanders
Scandinavians
25.9%
DISABILITY AGE 65 TO 74
0.1/ 100
METRIC RATING
279th/ 347
METRIC RANK
23.4%
DISABILITY AGE 65 TO 74
45.6/ 100
METRIC RATING
180th/ 347
METRIC RANK
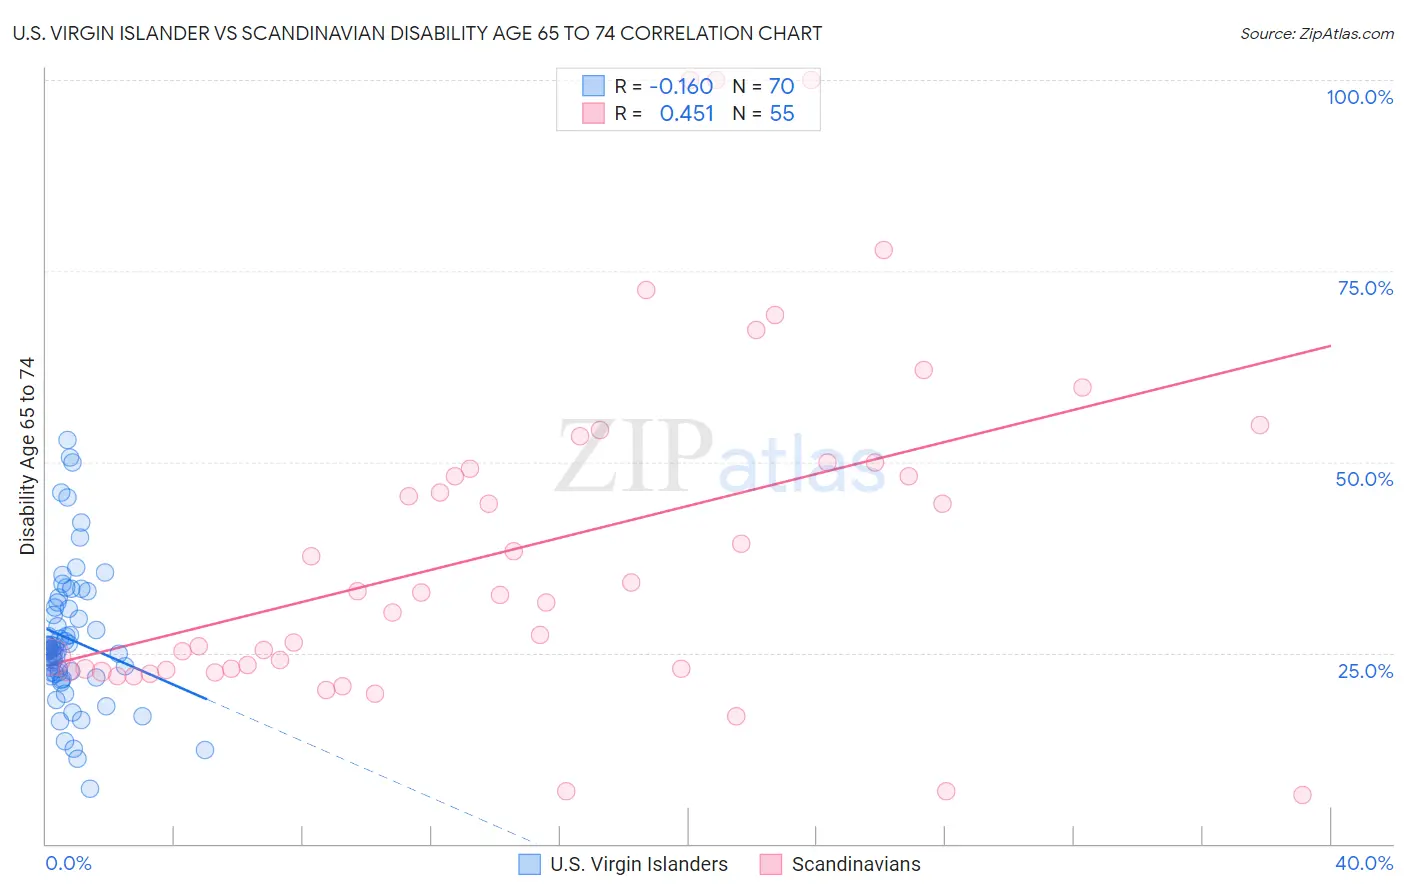
U.S. Virgin Islander vs Scandinavian Disability Age 65 to 74 Correlation Chart
The statistical analysis conducted on geographies consisting of 87,465,301 people shows a poor negative correlation between the proportion of U.S. Virgin Islanders and percentage of population with a disability between the ages 65 and 75 in the United States with a correlation coefficient (R) of -0.160 and weighted average of 25.9%. Similarly, the statistical analysis conducted on geographies consisting of 471,353,341 people shows a moderate positive correlation between the proportion of Scandinavians and percentage of population with a disability between the ages 65 and 75 in the United States with a correlation coefficient (R) of 0.451 and weighted average of 23.4%, a difference of 10.5%.
Disability Age 65 to 74 Correlation Summary
| Measurement | U.S. Virgin Islander | Scandinavian |
| Minimum | 7.1% | 6.4% |
| Maximum | 52.9% | 100.0% |
| Range | 45.8% | 93.6% |
| Mean | 26.8% | 38.7% |
| Median | 25.6% | 32.5% |
| Interquartile 25% (IQ1) | 22.3% | 22.7% |
| Interquartile 75% (IQ3) | 30.9% | 50.0% |
| Interquartile Range (IQR) | 8.6% | 27.3% |
| Standard Deviation (Sample) | 9.0% | 22.4% |
| Standard Deviation (Population) | 9.0% | 22.2% |
Similar Demographics by Disability Age 65 to 74
Demographics Similar to U.S. Virgin Islanders by Disability Age 65 to 74
In terms of disability age 65 to 74, the demographic groups most similar to U.S. Virgin Islanders are Immigrants from Belize (25.8%, a difference of 0.080%), Cree (25.9%, a difference of 0.080%), Belizean (25.8%, a difference of 0.10%), Immigrants from Honduras (25.9%, a difference of 0.10%), and Delaware (25.9%, a difference of 0.18%).
| Demographics | Rating | Rank | Disability Age 65 to 74 |
| Immigrants | Dominica | 0.1 /100 | #272 | Tragic 25.7% |
| Japanese | 0.1 /100 | #273 | Tragic 25.7% |
| Americans | 0.1 /100 | #274 | Tragic 25.8% |
| Hondurans | 0.1 /100 | #275 | Tragic 25.8% |
| French American Indians | 0.1 /100 | #276 | Tragic 25.8% |
| Belizeans | 0.1 /100 | #277 | Tragic 25.8% |
| Immigrants | Belize | 0.1 /100 | #278 | Tragic 25.8% |
| U.S. Virgin Islanders | 0.1 /100 | #279 | Tragic 25.9% |
| Cree | 0.1 /100 | #280 | Tragic 25.9% |
| Immigrants | Honduras | 0.1 /100 | #281 | Tragic 25.9% |
| Delaware | 0.1 /100 | #282 | Tragic 25.9% |
| Spanish Americans | 0.0 /100 | #283 | Tragic 25.9% |
| Immigrants | Azores | 0.0 /100 | #284 | Tragic 26.0% |
| Immigrants | Congo | 0.0 /100 | #285 | Tragic 26.0% |
| Immigrants | Micronesia | 0.0 /100 | #286 | Tragic 26.1% |
Demographics Similar to Scandinavians by Disability Age 65 to 74
In terms of disability age 65 to 74, the demographic groups most similar to Scandinavians are Immigrants from Sierra Leone (23.4%, a difference of 0.010%), Assyrian/Chaldean/Syriac (23.4%, a difference of 0.010%), Guyanese (23.4%, a difference of 0.020%), Irish (23.4%, a difference of 0.070%), and Immigrants from Haiti (23.4%, a difference of 0.11%).
| Demographics | Rating | Rank | Disability Age 65 to 74 |
| Yugoslavians | 50.2 /100 | #173 | Average 23.3% |
| Immigrants | South Eastern Asia | 50.0 /100 | #174 | Average 23.3% |
| Dutch | 49.4 /100 | #175 | Average 23.3% |
| Immigrants | Eritrea | 47.5 /100 | #176 | Average 23.4% |
| Immigrants | Haiti | 47.5 /100 | #177 | Average 23.4% |
| Guyanese | 45.8 /100 | #178 | Average 23.4% |
| Immigrants | Sierra Leone | 45.8 /100 | #179 | Average 23.4% |
| Scandinavians | 45.6 /100 | #180 | Average 23.4% |
| Assyrians/Chaldeans/Syriacs | 45.3 /100 | #181 | Average 23.4% |
| Irish | 44.4 /100 | #182 | Average 23.4% |
| Immigrants | Eastern Africa | 42.8 /100 | #183 | Average 23.4% |
| Immigrants | Germany | 42.5 /100 | #184 | Average 23.4% |
| Haitians | 42.4 /100 | #185 | Average 23.4% |
| Basques | 38.4 /100 | #186 | Fair 23.5% |
| Portuguese | 37.8 /100 | #187 | Fair 23.5% |