U.S. Virgin Islander vs Immigrants from India Disability Age 35 to 64
COMPARE
U.S. Virgin Islander
Immigrants from India
Disability Age 35 to 64
Disability Age 35 to 64 Comparison
U.S. Virgin Islanders
Immigrants from India
12.8%
DISABILITY AGE 35 TO 64
0.1/ 100
METRIC RATING
272nd/ 347
METRIC RANK
8.3%
DISABILITY AGE 35 TO 64
100.0/ 100
METRIC RATING
4th/ 347
METRIC RANK
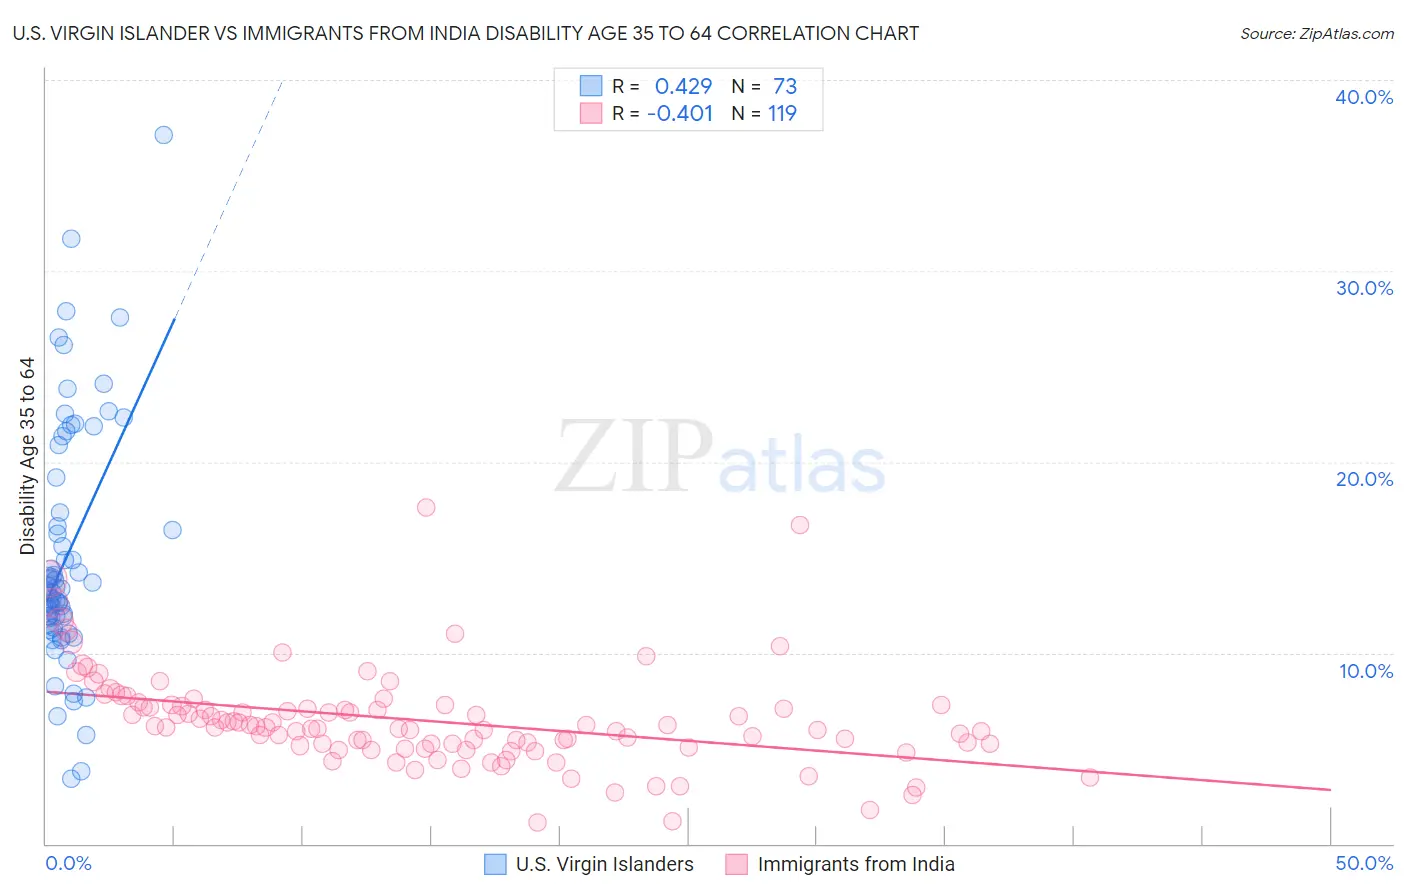
U.S. Virgin Islander vs Immigrants from India Disability Age 35 to 64 Correlation Chart
The statistical analysis conducted on geographies consisting of 87,508,823 people shows a moderate positive correlation between the proportion of U.S. Virgin Islanders and percentage of population with a disability between the ages 34 and 64 in the United States with a correlation coefficient (R) of 0.429 and weighted average of 12.8%. Similarly, the statistical analysis conducted on geographies consisting of 433,679,908 people shows a moderate negative correlation between the proportion of Immigrants from India and percentage of population with a disability between the ages 34 and 64 in the United States with a correlation coefficient (R) of -0.401 and weighted average of 8.3%, a difference of 55.0%.
Disability Age 35 to 64 Correlation Summary
| Measurement | U.S. Virgin Islander | Immigrants from India |
| Minimum | 3.4% | 1.1% |
| Maximum | 37.1% | 17.6% |
| Range | 33.7% | 16.5% |
| Mean | 15.0% | 6.5% |
| Median | 13.2% | 6.1% |
| Interquartile 25% (IQ1) | 11.4% | 5.1% |
| Interquartile 75% (IQ3) | 18.3% | 7.2% |
| Interquartile Range (IQR) | 6.8% | 2.1% |
| Standard Deviation (Sample) | 6.4% | 2.6% |
| Standard Deviation (Population) | 6.3% | 2.6% |
Similar Demographics by Disability Age 35 to 64
Demographics Similar to U.S. Virgin Islanders by Disability Age 35 to 64
In terms of disability age 35 to 64, the demographic groups most similar to U.S. Virgin Islanders are Pennsylvania German (12.8%, a difference of 0.080%), Celtic (12.9%, a difference of 0.11%), Nepalese (12.8%, a difference of 0.12%), Dominican (12.9%, a difference of 0.25%), and Somali (12.9%, a difference of 0.37%).
| Demographics | Rating | Rank | Disability Age 35 to 64 |
| Marshallese | 0.4 /100 | #265 | Tragic 12.5% |
| Whites/Caucasians | 0.3 /100 | #266 | Tragic 12.6% |
| Sub-Saharan Africans | 0.2 /100 | #267 | Tragic 12.6% |
| Immigrants | Dominica | 0.2 /100 | #268 | Tragic 12.7% |
| Spanish | 0.2 /100 | #269 | Tragic 12.7% |
| French | 0.2 /100 | #270 | Tragic 12.7% |
| Nepalese | 0.1 /100 | #271 | Tragic 12.8% |
| U.S. Virgin Islanders | 0.1 /100 | #272 | Tragic 12.8% |
| Pennsylvania Germans | 0.1 /100 | #273 | Tragic 12.8% |
| Celtics | 0.1 /100 | #274 | Tragic 12.9% |
| Dominicans | 0.1 /100 | #275 | Tragic 12.9% |
| Somalis | 0.1 /100 | #276 | Tragic 12.9% |
| Immigrants | Dominican Republic | 0.1 /100 | #277 | Tragic 12.9% |
| French Canadians | 0.1 /100 | #278 | Tragic 12.9% |
| Immigrants | Micronesia | 0.1 /100 | #279 | Tragic 12.9% |
Demographics Similar to Immigrants from India by Disability Age 35 to 64
In terms of disability age 35 to 64, the demographic groups most similar to Immigrants from India are Immigrants from Hong Kong (8.2%, a difference of 1.1%), Immigrants from Iran (8.5%, a difference of 2.5%), Filipino (8.0%, a difference of 2.9%), Thai (8.6%, a difference of 3.5%), and Immigrants from Israel (8.6%, a difference of 4.0%).
| Demographics | Rating | Rank | Disability Age 35 to 64 |
| Immigrants | Taiwan | 100.0 /100 | #1 | Exceptional 7.8% |
| Filipinos | 100.0 /100 | #2 | Exceptional 8.0% |
| Immigrants | Hong Kong | 100.0 /100 | #3 | Exceptional 8.2% |
| Immigrants | India | 100.0 /100 | #4 | Exceptional 8.3% |
| Immigrants | Iran | 100.0 /100 | #5 | Exceptional 8.5% |
| Thais | 100.0 /100 | #6 | Exceptional 8.6% |
| Immigrants | Israel | 100.0 /100 | #7 | Exceptional 8.6% |
| Iranians | 100.0 /100 | #8 | Exceptional 8.7% |
| Immigrants | China | 100.0 /100 | #9 | Exceptional 8.7% |
| Immigrants | Bolivia | 100.0 /100 | #10 | Exceptional 8.7% |
| Immigrants | Eastern Asia | 100.0 /100 | #11 | Exceptional 8.8% |
| Indians (Asian) | 100.0 /100 | #12 | Exceptional 8.9% |
| Immigrants | South Central Asia | 100.0 /100 | #13 | Exceptional 8.9% |
| Immigrants | Singapore | 100.0 /100 | #14 | Exceptional 8.9% |
| Bolivians | 100.0 /100 | #15 | Exceptional 8.9% |