Ukrainian vs Immigrants from Cabo Verde Ambulatory Disability
COMPARE
Ukrainian
Immigrants from Cabo Verde
Ambulatory Disability
Ambulatory Disability Comparison
Ukrainians
Immigrants from Cabo Verde
6.2%
AMBULATORY DISABILITY
34.0/ 100
METRIC RATING
189th/ 347
METRIC RANK
7.0%
AMBULATORY DISABILITY
0.0/ 100
METRIC RATING
304th/ 347
METRIC RANK
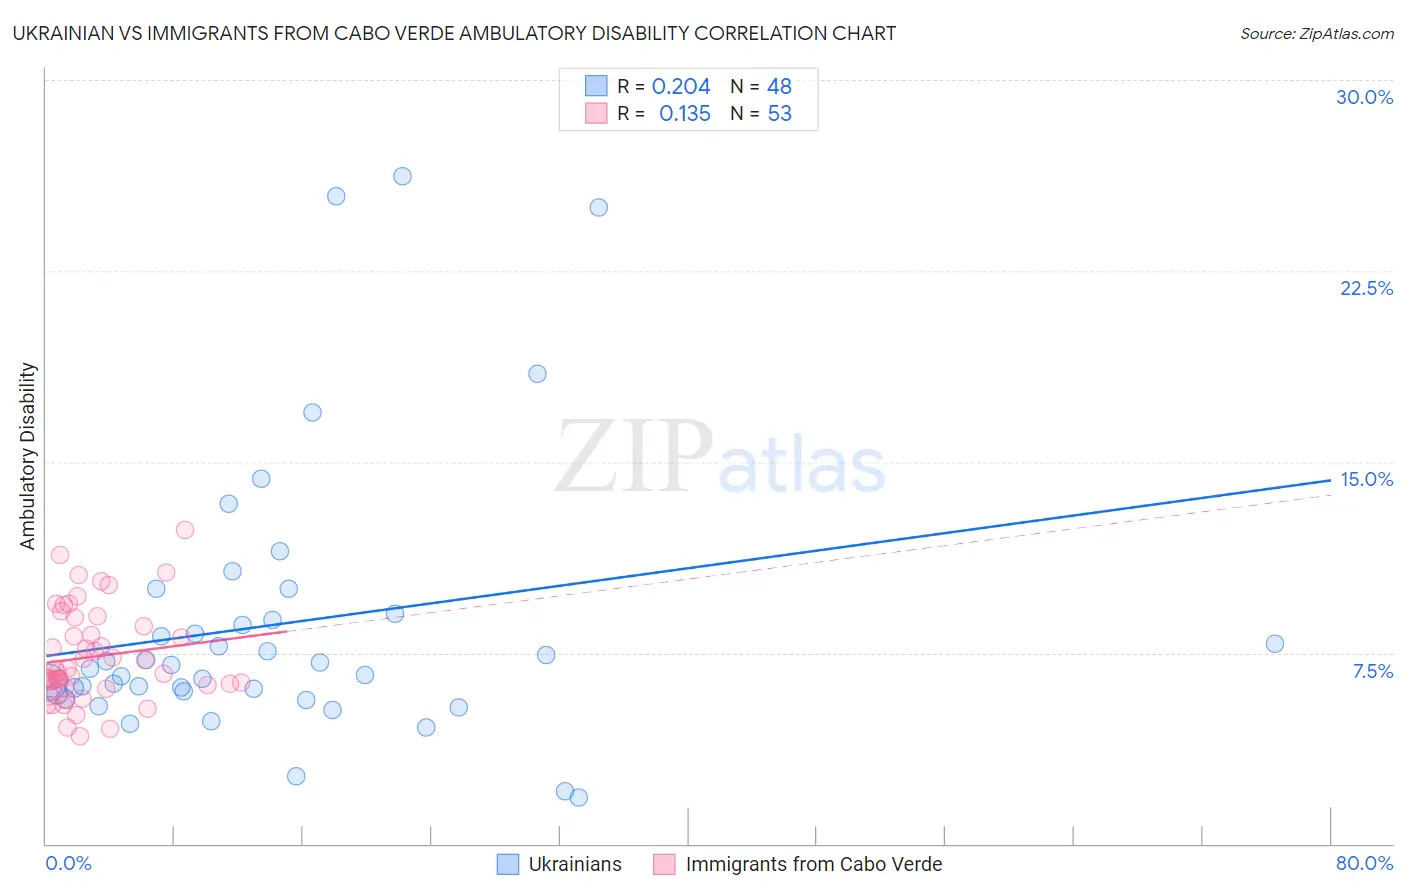
Ukrainian vs Immigrants from Cabo Verde Ambulatory Disability Correlation Chart
The statistical analysis conducted on geographies consisting of 448,487,424 people shows a weak positive correlation between the proportion of Ukrainians and percentage of population with ambulatory disability in the United States with a correlation coefficient (R) of 0.204 and weighted average of 6.2%. Similarly, the statistical analysis conducted on geographies consisting of 38,149,836 people shows a poor positive correlation between the proportion of Immigrants from Cabo Verde and percentage of population with ambulatory disability in the United States with a correlation coefficient (R) of 0.135 and weighted average of 7.0%, a difference of 13.3%.
Ambulatory Disability Correlation Summary
| Measurement | Ukrainian | Immigrants from Cabo Verde |
| Minimum | 1.8% | 4.2% |
| Maximum | 26.2% | 12.3% |
| Range | 24.4% | 8.1% |
| Mean | 8.6% | 7.3% |
| Median | 6.9% | 6.7% |
| Interquartile 25% (IQ1) | 5.9% | 6.2% |
| Interquartile 75% (IQ3) | 8.9% | 8.7% |
| Interquartile Range (IQR) | 3.0% | 2.5% |
| Standard Deviation (Sample) | 5.5% | 1.8% |
| Standard Deviation (Population) | 5.4% | 1.8% |
Similar Demographics by Ambulatory Disability
Demographics Similar to Ukrainians by Ambulatory Disability
In terms of ambulatory disability, the demographic groups most similar to Ukrainians are British (6.2%, a difference of 0.020%), Immigrants from Western Africa (6.2%, a difference of 0.040%), Carpatho Rusyn (6.2%, a difference of 0.080%), Immigrants from Guatemala (6.2%, a difference of 0.12%), and European (6.2%, a difference of 0.13%).
| Demographics | Rating | Rank | Ambulatory Disability |
| Serbians | 42.8 /100 | #182 | Average 6.1% |
| Immigrants | Thailand | 42.2 /100 | #183 | Average 6.1% |
| Immigrants | Ghana | 41.2 /100 | #184 | Average 6.1% |
| Immigrants | Bosnia and Herzegovina | 37.2 /100 | #185 | Fair 6.2% |
| Europeans | 36.2 /100 | #186 | Fair 6.2% |
| Carpatho Rusyns | 35.3 /100 | #187 | Fair 6.2% |
| British | 34.3 /100 | #188 | Fair 6.2% |
| Ukrainians | 34.0 /100 | #189 | Fair 6.2% |
| Immigrants | Western Africa | 33.4 /100 | #190 | Fair 6.2% |
| Immigrants | Guatemala | 31.9 /100 | #191 | Fair 6.2% |
| Immigrants | Western Europe | 31.6 /100 | #192 | Fair 6.2% |
| Guatemalans | 30.0 /100 | #193 | Fair 6.2% |
| Alaska Natives | 29.8 /100 | #194 | Fair 6.2% |
| Belgians | 28.6 /100 | #195 | Fair 6.2% |
| Malaysians | 28.2 /100 | #196 | Fair 6.2% |
Demographics Similar to Immigrants from Cabo Verde by Ambulatory Disability
In terms of ambulatory disability, the demographic groups most similar to Immigrants from Cabo Verde are Immigrants from Micronesia (7.0%, a difference of 0.29%), African (7.0%, a difference of 0.36%), Immigrants from Armenia (7.0%, a difference of 0.42%), British West Indian (7.0%, a difference of 0.47%), and Marshallese (6.9%, a difference of 0.70%).
| Demographics | Rating | Rank | Ambulatory Disability |
| French American Indians | 0.0 /100 | #297 | Tragic 6.9% |
| Immigrants | Grenada | 0.0 /100 | #298 | Tragic 6.9% |
| Puget Sound Salish | 0.0 /100 | #299 | Tragic 6.9% |
| Marshallese | 0.0 /100 | #300 | Tragic 6.9% |
| British West Indians | 0.0 /100 | #301 | Tragic 7.0% |
| Immigrants | Armenia | 0.0 /100 | #302 | Tragic 7.0% |
| Africans | 0.0 /100 | #303 | Tragic 7.0% |
| Immigrants | Cabo Verde | 0.0 /100 | #304 | Tragic 7.0% |
| Immigrants | Micronesia | 0.0 /100 | #305 | Tragic 7.0% |
| Iroquois | 0.0 /100 | #306 | Tragic 7.1% |
| Spanish Americans | 0.0 /100 | #307 | Tragic 7.1% |
| Chippewa | 0.0 /100 | #308 | Tragic 7.1% |
| Immigrants | Azores | 0.0 /100 | #309 | Tragic 7.1% |
| Arapaho | 0.0 /100 | #310 | Tragic 7.1% |
| Cree | 0.0 /100 | #311 | Tragic 7.1% |