Ugandan vs Apache Disability Age 35 to 64
COMPARE
Ugandan
Apache
Disability Age 35 to 64
Disability Age 35 to 64 Comparison
Ugandans
Apache
11.3%
DISABILITY AGE 35 TO 64
43.7/ 100
METRIC RATING
176th/ 347
METRIC RANK
14.9%
DISABILITY AGE 35 TO 64
0.0/ 100
METRIC RATING
323rd/ 347
METRIC RANK
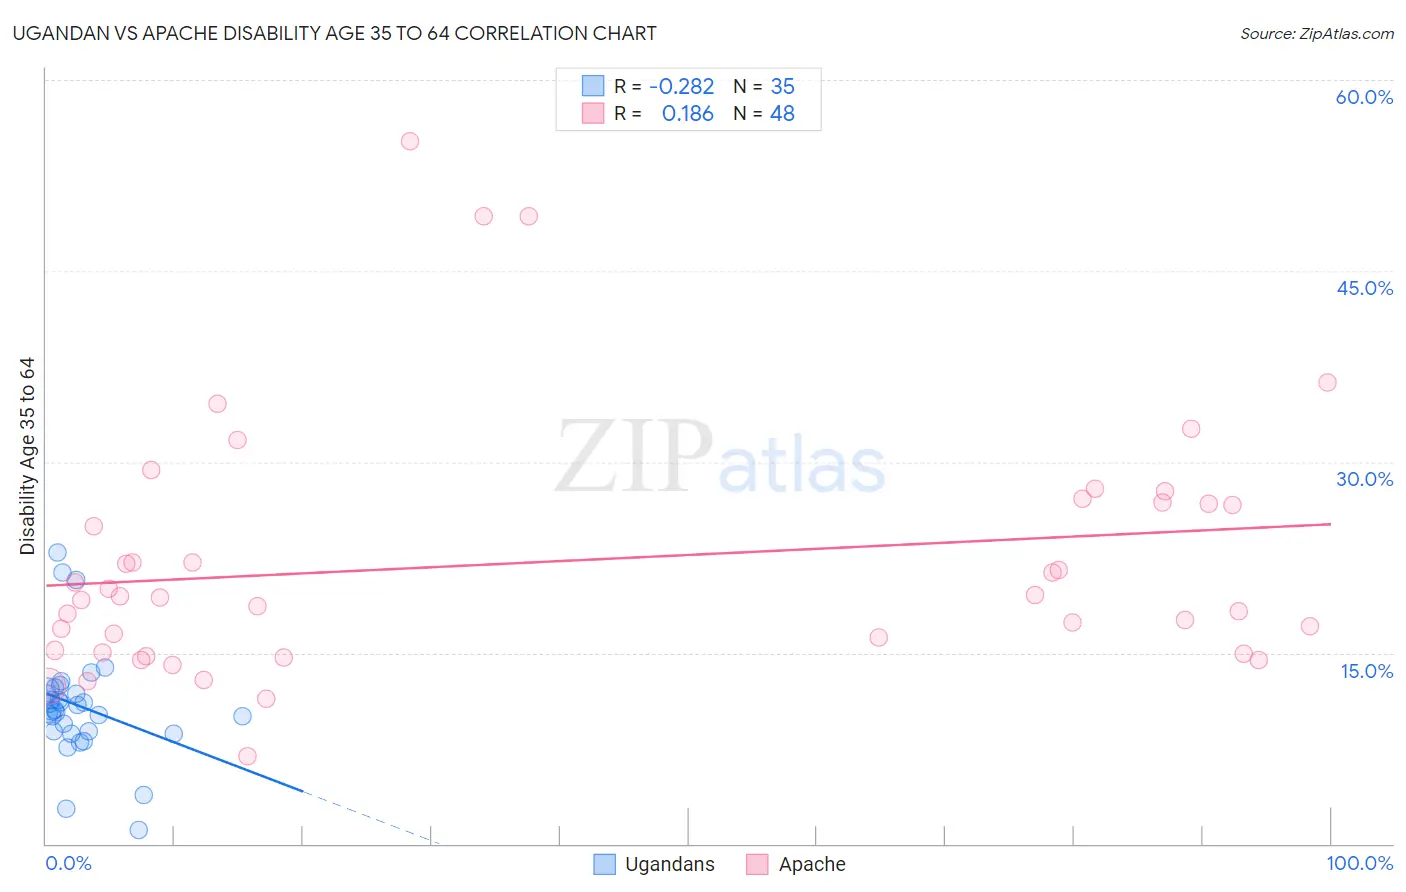
Ugandan vs Apache Disability Age 35 to 64 Correlation Chart
The statistical analysis conducted on geographies consisting of 93,995,373 people shows a weak negative correlation between the proportion of Ugandans and percentage of population with a disability between the ages 34 and 64 in the United States with a correlation coefficient (R) of -0.282 and weighted average of 11.3%. Similarly, the statistical analysis conducted on geographies consisting of 231,024,095 people shows a poor positive correlation between the proportion of Apache and percentage of population with a disability between the ages 34 and 64 in the United States with a correlation coefficient (R) of 0.186 and weighted average of 14.9%, a difference of 31.8%.
Disability Age 35 to 64 Correlation Summary
| Measurement | Ugandan | Apache |
| Minimum | 1.1% | 6.9% |
| Maximum | 22.8% | 55.2% |
| Range | 21.7% | 48.3% |
| Mean | 10.8% | 22.1% |
| Median | 10.5% | 19.4% |
| Interquartile 25% (IQ1) | 8.8% | 15.1% |
| Interquartile 75% (IQ3) | 12.1% | 26.8% |
| Interquartile Range (IQR) | 3.3% | 11.7% |
| Standard Deviation (Sample) | 4.3% | 9.9% |
| Standard Deviation (Population) | 4.3% | 9.8% |
Similar Demographics by Disability Age 35 to 64
Demographics Similar to Ugandans by Disability Age 35 to 64
In terms of disability age 35 to 64, the demographic groups most similar to Ugandans are Immigrants from Eastern Africa (11.3%, a difference of 0.12%), Polish (11.3%, a difference of 0.14%), Immigrants from Barbados (11.3%, a difference of 0.18%), Immigrants from Caribbean (11.3%, a difference of 0.18%), and Trinidadian and Tobagonian (11.4%, a difference of 0.24%).
| Demographics | Rating | Rank | Disability Age 35 to 64 |
| Haitians | 59.0 /100 | #169 | Average 11.2% |
| Immigrants | Uganda | 58.0 /100 | #170 | Average 11.2% |
| Immigrants | Trinidad and Tobago | 55.9 /100 | #171 | Average 11.2% |
| Italians | 55.6 /100 | #172 | Average 11.2% |
| Lebanese | 51.8 /100 | #173 | Average 11.3% |
| Immigrants | Fiji | 50.0 /100 | #174 | Average 11.3% |
| Czechs | 47.9 /100 | #175 | Average 11.3% |
| Ugandans | 43.7 /100 | #176 | Average 11.3% |
| Immigrants | Eastern Africa | 42.2 /100 | #177 | Average 11.3% |
| Poles | 42.0 /100 | #178 | Average 11.3% |
| Immigrants | Barbados | 41.6 /100 | #179 | Average 11.3% |
| Immigrants | Caribbean | 41.5 /100 | #180 | Average 11.3% |
| Trinidadians and Tobagonians | 40.8 /100 | #181 | Average 11.4% |
| Icelanders | 39.7 /100 | #182 | Fair 11.4% |
| Immigrants | Oceania | 39.5 /100 | #183 | Fair 11.4% |
Demographics Similar to Apache by Disability Age 35 to 64
In terms of disability age 35 to 64, the demographic groups most similar to Apache are Chippewa (15.0%, a difference of 0.20%), Arapaho (15.1%, a difference of 0.87%), Potawatomi (14.8%, a difference of 1.2%), Comanche (14.7%, a difference of 1.3%), and Black/African American (14.7%, a difference of 1.5%).
| Demographics | Rating | Rank | Disability Age 35 to 64 |
| Osage | 0.0 /100 | #316 | Tragic 14.5% |
| Crow | 0.0 /100 | #317 | Tragic 14.6% |
| Ottawa | 0.0 /100 | #318 | Tragic 14.6% |
| Immigrants | Cabo Verde | 0.0 /100 | #319 | Tragic 14.7% |
| Blacks/African Americans | 0.0 /100 | #320 | Tragic 14.7% |
| Comanche | 0.0 /100 | #321 | Tragic 14.7% |
| Potawatomi | 0.0 /100 | #322 | Tragic 14.8% |
| Apache | 0.0 /100 | #323 | Tragic 14.9% |
| Chippewa | 0.0 /100 | #324 | Tragic 15.0% |
| Arapaho | 0.0 /100 | #325 | Tragic 15.1% |
| Natives/Alaskans | 0.0 /100 | #326 | Tragic 15.3% |
| Pueblo | 0.0 /100 | #327 | Tragic 15.3% |
| Cajuns | 0.0 /100 | #328 | Tragic 15.3% |
| Cherokee | 0.0 /100 | #329 | Tragic 15.5% |
| Navajo | 0.0 /100 | #330 | Tragic 15.5% |