Turkish vs Immigrants from South Eastern Asia Cognitive Disability
COMPARE
Turkish
Immigrants from South Eastern Asia
Cognitive Disability
Cognitive Disability Comparison
Turks
Immigrants from South Eastern Asia
16.9%
COGNITIVE DISABILITY
94.5/ 100
METRIC RATING
124th/ 347
METRIC RANK
17.0%
COGNITIVE DISABILITY
88.7/ 100
METRIC RATING
145th/ 347
METRIC RANK
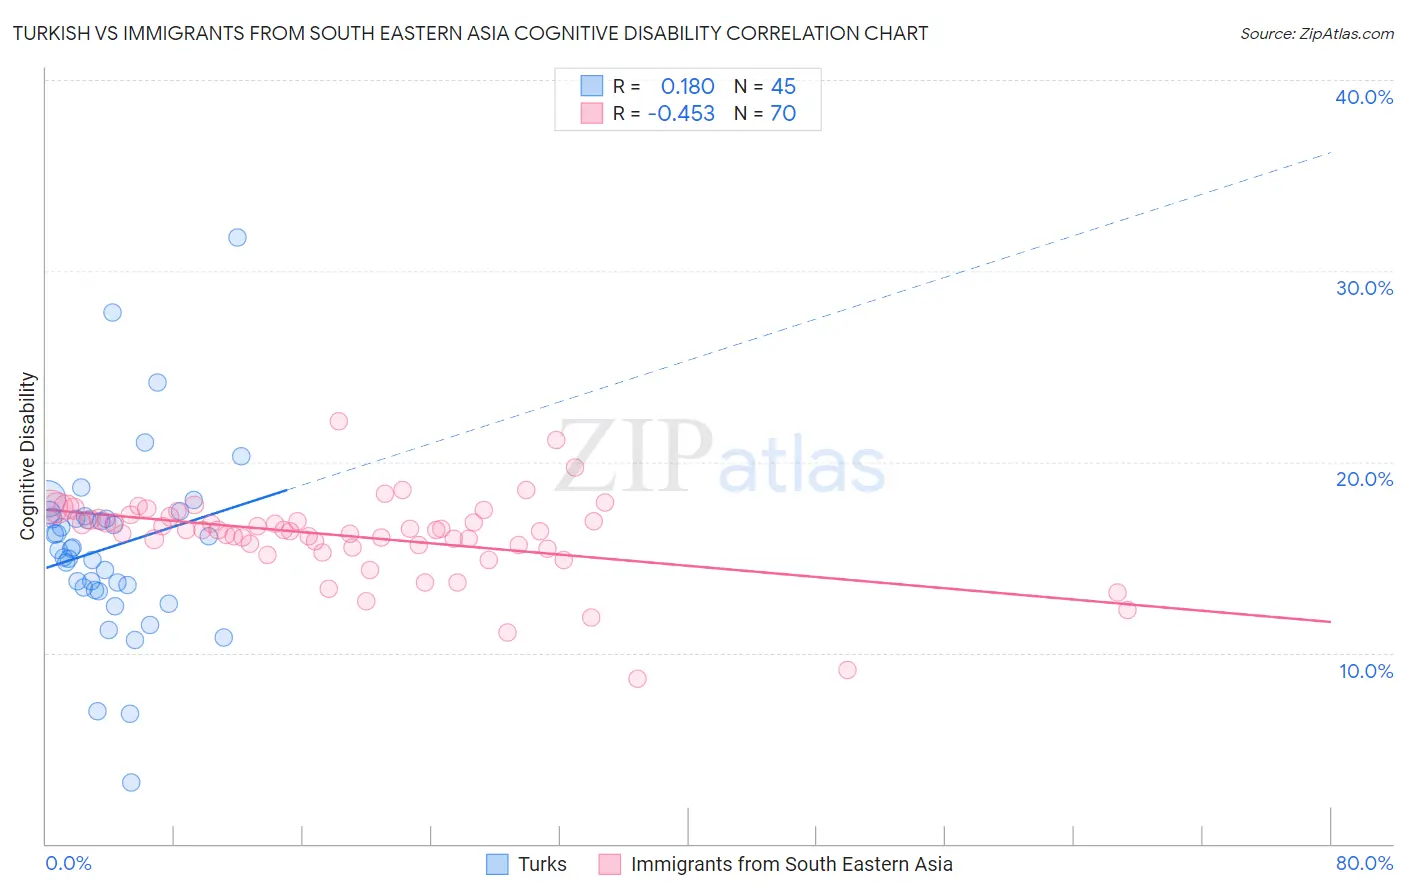
Turkish vs Immigrants from South Eastern Asia Cognitive Disability Correlation Chart
The statistical analysis conducted on geographies consisting of 271,856,342 people shows a poor positive correlation between the proportion of Turks and percentage of population with cognitive disability in the United States with a correlation coefficient (R) of 0.180 and weighted average of 16.9%. Similarly, the statistical analysis conducted on geographies consisting of 512,576,863 people shows a moderate negative correlation between the proportion of Immigrants from South Eastern Asia and percentage of population with cognitive disability in the United States with a correlation coefficient (R) of -0.453 and weighted average of 17.0%, a difference of 0.58%.
Cognitive Disability Correlation Summary
| Measurement | Turkish | Immigrants from South Eastern Asia |
| Minimum | 3.2% | 8.6% |
| Maximum | 31.8% | 22.1% |
| Range | 28.5% | 13.5% |
| Mean | 15.5% | 16.1% |
| Median | 15.5% | 16.4% |
| Interquartile 25% (IQ1) | 13.4% | 15.6% |
| Interquartile 75% (IQ3) | 17.1% | 17.1% |
| Interquartile Range (IQR) | 3.8% | 1.5% |
| Standard Deviation (Sample) | 4.8% | 2.2% |
| Standard Deviation (Population) | 4.8% | 2.2% |
Similar Demographics by Cognitive Disability
Demographics Similar to Turks by Cognitive Disability
In terms of cognitive disability, the demographic groups most similar to Turks are Portuguese (16.9%, a difference of 0.020%), Immigrants from Western Europe (16.9%, a difference of 0.030%), Immigrants from China (16.9%, a difference of 0.050%), Scandinavian (16.9%, a difference of 0.050%), and Scottish (16.9%, a difference of 0.070%).
| Demographics | Rating | Rank | Cognitive Disability |
| Immigrants | Japan | 96.2 /100 | #117 | Exceptional 16.9% |
| Immigrants | Denmark | 96.2 /100 | #118 | Exceptional 16.9% |
| South Africans | 95.5 /100 | #119 | Exceptional 16.9% |
| Scottish | 95.0 /100 | #120 | Exceptional 16.9% |
| Immigrants | China | 94.9 /100 | #121 | Exceptional 16.9% |
| Immigrants | Western Europe | 94.8 /100 | #122 | Exceptional 16.9% |
| Portuguese | 94.7 /100 | #123 | Exceptional 16.9% |
| Turks | 94.5 /100 | #124 | Exceptional 16.9% |
| Scandinavians | 94.1 /100 | #125 | Exceptional 16.9% |
| Europeans | 93.4 /100 | #126 | Exceptional 17.0% |
| Immigrants | Costa Rica | 93.1 /100 | #127 | Exceptional 17.0% |
| Nicaraguans | 93.0 /100 | #128 | Exceptional 17.0% |
| Immigrants | Uruguay | 92.9 /100 | #129 | Exceptional 17.0% |
| Immigrants | Vietnam | 92.4 /100 | #130 | Exceptional 17.0% |
| Immigrants | Germany | 92.1 /100 | #131 | Exceptional 17.0% |
Demographics Similar to Immigrants from South Eastern Asia by Cognitive Disability
In terms of cognitive disability, the demographic groups most similar to Immigrants from South Eastern Asia are British (17.0%, a difference of 0.050%), Immigrants from Brazil (17.0%, a difference of 0.050%), Costa Rican (17.0%, a difference of 0.050%), Carpatho Rusyn (17.0%, a difference of 0.070%), and Aleut (17.0%, a difference of 0.090%).
| Demographics | Rating | Rank | Cognitive Disability |
| Welsh | 90.8 /100 | #138 | Exceptional 17.0% |
| French | 90.0 /100 | #139 | Excellent 17.0% |
| Chileans | 89.9 /100 | #140 | Excellent 17.0% |
| Aleuts | 89.9 /100 | #141 | Excellent 17.0% |
| Carpatho Rusyns | 89.6 /100 | #142 | Excellent 17.0% |
| British | 89.3 /100 | #143 | Excellent 17.0% |
| Immigrants | Brazil | 89.3 /100 | #144 | Excellent 17.0% |
| Immigrants | South Eastern Asia | 88.7 /100 | #145 | Excellent 17.0% |
| Costa Ricans | 88.0 /100 | #146 | Excellent 17.0% |
| Scotch-Irish | 85.9 /100 | #147 | Excellent 17.1% |
| French Canadians | 85.7 /100 | #148 | Excellent 17.1% |
| Cypriots | 85.7 /100 | #149 | Excellent 17.1% |
| Basques | 85.5 /100 | #150 | Excellent 17.1% |
| Syrians | 83.0 /100 | #151 | Excellent 17.1% |
| Immigrants | Indonesia | 82.7 /100 | #152 | Excellent 17.1% |