Trinidadian and Tobagonian vs Slavic Vision Disability
COMPARE
Trinidadian and Tobagonian
Slavic
Vision Disability
Vision Disability Comparison
Trinidadians and Tobagonians
Slavs
2.2%
VISION DISABILITY
8.2/ 100
METRIC RATING
214th/ 347
METRIC RANK
2.2%
VISION DISABILITY
46.0/ 100
METRIC RATING
177th/ 347
METRIC RANK
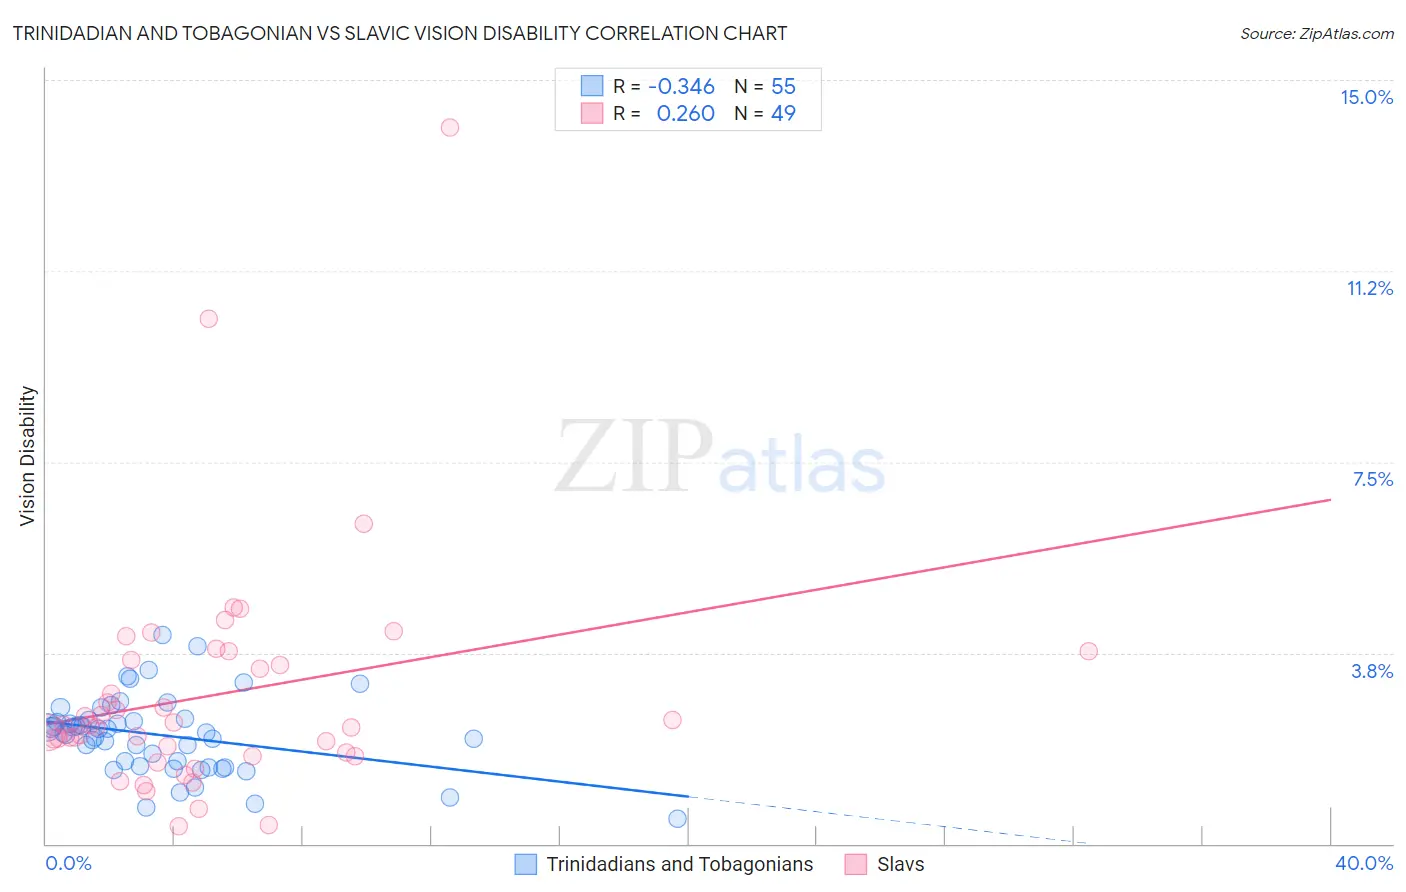
Trinidadian and Tobagonian vs Slavic Vision Disability Correlation Chart
The statistical analysis conducted on geographies consisting of 219,745,653 people shows a mild negative correlation between the proportion of Trinidadians and Tobagonians and percentage of population with vision disability in the United States with a correlation coefficient (R) of -0.346 and weighted average of 2.2%. Similarly, the statistical analysis conducted on geographies consisting of 270,742,725 people shows a weak positive correlation between the proportion of Slavs and percentage of population with vision disability in the United States with a correlation coefficient (R) of 0.260 and weighted average of 2.2%, a difference of 3.5%.
Vision Disability Correlation Summary
| Measurement | Trinidadian and Tobagonian | Slavic |
| Minimum | 0.49% | 0.34% |
| Maximum | 4.1% | 14.1% |
| Range | 3.6% | 13.7% |
| Mean | 2.1% | 2.9% |
| Median | 2.2% | 2.3% |
| Interquartile 25% (IQ1) | 1.5% | 1.8% |
| Interquartile 75% (IQ3) | 2.4% | 3.7% |
| Interquartile Range (IQR) | 0.92% | 1.9% |
| Standard Deviation (Sample) | 0.75% | 2.3% |
| Standard Deviation (Population) | 0.74% | 2.3% |
Similar Demographics by Vision Disability
Demographics Similar to Trinidadians and Tobagonians by Vision Disability
In terms of vision disability, the demographic groups most similar to Trinidadians and Tobagonians are Immigrants from Ghana (2.2%, a difference of 0.13%), Bermudan (2.2%, a difference of 0.14%), Nigerian (2.3%, a difference of 0.21%), Indonesian (2.2%, a difference of 0.23%), and Immigrants from Trinidad and Tobago (2.3%, a difference of 0.50%).
| Demographics | Rating | Rank | Vision Disability |
| Immigrants | Nigeria | 13.5 /100 | #207 | Poor 2.2% |
| Germans | 13.4 /100 | #208 | Poor 2.2% |
| Immigrants | Brazil | 13.1 /100 | #209 | Poor 2.2% |
| Immigrants | Uruguay | 11.5 /100 | #210 | Poor 2.2% |
| Indonesians | 9.5 /100 | #211 | Tragic 2.2% |
| Bermudans | 9.0 /100 | #212 | Tragic 2.2% |
| Immigrants | Ghana | 8.9 /100 | #213 | Tragic 2.2% |
| Trinidadians and Tobagonians | 8.2 /100 | #214 | Tragic 2.2% |
| Nigerians | 7.2 /100 | #215 | Tragic 2.3% |
| Immigrants | Trinidad and Tobago | 6.1 /100 | #216 | Tragic 2.3% |
| Barbadians | 5.1 /100 | #217 | Tragic 2.3% |
| Portuguese | 4.9 /100 | #218 | Tragic 2.3% |
| Ecuadorians | 4.6 /100 | #219 | Tragic 2.3% |
| Guamanians/Chamorros | 3.9 /100 | #220 | Tragic 2.3% |
| French Canadians | 3.9 /100 | #221 | Tragic 2.3% |
Demographics Similar to Slavs by Vision Disability
In terms of vision disability, the demographic groups most similar to Slavs are Yugoslavian (2.2%, a difference of 0.040%), Immigrants from Oceania (2.2%, a difference of 0.050%), Immigrants from North America (2.2%, a difference of 0.090%), Immigrants from Fiji (2.2%, a difference of 0.11%), and Uruguayan (2.2%, a difference of 0.21%).
| Demographics | Rating | Rank | Vision Disability |
| Swiss | 55.7 /100 | #170 | Average 2.2% |
| Lebanese | 54.3 /100 | #171 | Average 2.2% |
| Northern Europeans | 50.1 /100 | #172 | Average 2.2% |
| Scandinavians | 50.0 /100 | #173 | Average 2.2% |
| Immigrants | Canada | 50.0 /100 | #174 | Average 2.2% |
| Immigrants | Fiji | 47.6 /100 | #175 | Average 2.2% |
| Yugoslavians | 46.5 /100 | #176 | Average 2.2% |
| Slavs | 46.0 /100 | #177 | Average 2.2% |
| Immigrants | Oceania | 45.1 /100 | #178 | Average 2.2% |
| Immigrants | North America | 44.5 /100 | #179 | Average 2.2% |
| Uruguayans | 42.7 /100 | #180 | Average 2.2% |
| Immigrants | Western Europe | 41.1 /100 | #181 | Average 2.2% |
| Costa Ricans | 40.7 /100 | #182 | Average 2.2% |
| Immigrants | Burma/Myanmar | 37.9 /100 | #183 | Fair 2.2% |
| Moroccans | 35.4 /100 | #184 | Fair 2.2% |