Trinidadian and Tobagonian vs Fijian Disability Age 65 to 74
COMPARE
Trinidadian and Tobagonian
Fijian
Disability Age 65 to 74
Disability Age 65 to 74 Comparison
Trinidadians and Tobagonians
Fijians
23.9%
DISABILITY AGE 65 TO 74
16.4/ 100
METRIC RATING
210th/ 347
METRIC RANK
27.0%
DISABILITY AGE 65 TO 74
0.0/ 100
METRIC RATING
297th/ 347
METRIC RANK
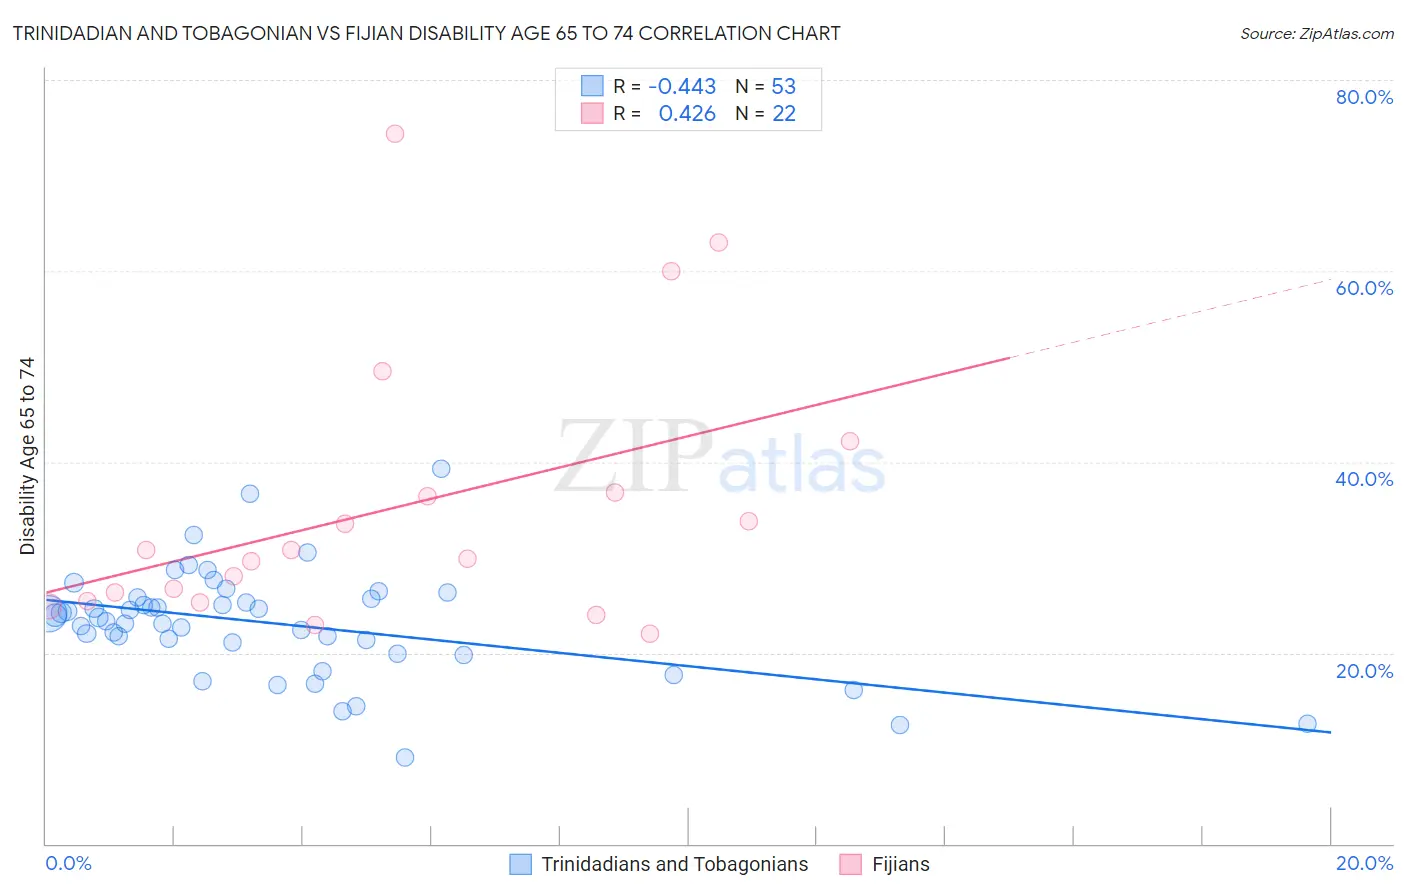
Trinidadian and Tobagonian vs Fijian Disability Age 65 to 74 Correlation Chart
The statistical analysis conducted on geographies consisting of 219,459,404 people shows a moderate negative correlation between the proportion of Trinidadians and Tobagonians and percentage of population with a disability between the ages 65 and 75 in the United States with a correlation coefficient (R) of -0.443 and weighted average of 23.9%. Similarly, the statistical analysis conducted on geographies consisting of 55,925,338 people shows a moderate positive correlation between the proportion of Fijians and percentage of population with a disability between the ages 65 and 75 in the United States with a correlation coefficient (R) of 0.426 and weighted average of 27.0%, a difference of 13.0%.
Disability Age 65 to 74 Correlation Summary
| Measurement | Trinidadian and Tobagonian | Fijian |
| Minimum | 9.0% | 22.0% |
| Maximum | 39.2% | 74.4% |
| Range | 30.2% | 52.4% |
| Mean | 23.1% | 35.3% |
| Median | 23.7% | 30.3% |
| Interquartile 25% (IQ1) | 20.5% | 25.4% |
| Interquartile 75% (IQ3) | 25.8% | 36.7% |
| Interquartile Range (IQR) | 5.3% | 11.3% |
| Standard Deviation (Sample) | 5.6% | 14.2% |
| Standard Deviation (Population) | 5.6% | 13.9% |
Similar Demographics by Disability Age 65 to 74
Demographics Similar to Trinidadians and Tobagonians by Disability Age 65 to 74
In terms of disability age 65 to 74, the demographic groups most similar to Trinidadians and Tobagonians are Immigrants from West Indies (23.9%, a difference of 0.050%), French (23.9%, a difference of 0.070%), Nicaraguan (23.9%, a difference of 0.23%), Immigrants from Barbados (23.8%, a difference of 0.31%), and Immigrants from Kenya (23.8%, a difference of 0.31%).
| Demographics | Rating | Rank | Disability Age 65 to 74 |
| Kenyans | 23.2 /100 | #203 | Fair 23.7% |
| Immigrants | Grenada | 22.1 /100 | #204 | Fair 23.8% |
| Tongans | 20.8 /100 | #205 | Fair 23.8% |
| Immigrants | Jamaica | 20.7 /100 | #206 | Fair 23.8% |
| Immigrants | Sudan | 20.1 /100 | #207 | Fair 23.8% |
| Immigrants | Barbados | 19.6 /100 | #208 | Poor 23.8% |
| Immigrants | Kenya | 19.6 /100 | #209 | Poor 23.8% |
| Trinidadians and Tobagonians | 16.4 /100 | #210 | Poor 23.9% |
| Immigrants | West Indies | 15.9 /100 | #211 | Poor 23.9% |
| French | 15.7 /100 | #212 | Poor 23.9% |
| Nicaraguans | 14.3 /100 | #213 | Poor 23.9% |
| Immigrants | Oceania | 13.6 /100 | #214 | Poor 24.0% |
| Pennsylvania Germans | 13.3 /100 | #215 | Poor 24.0% |
| Jamaicans | 12.2 /100 | #216 | Poor 24.0% |
| Immigrants | Portugal | 11.7 /100 | #217 | Poor 24.0% |
Demographics Similar to Fijians by Disability Age 65 to 74
In terms of disability age 65 to 74, the demographic groups most similar to Fijians are Immigrants from Yemen (27.0%, a difference of 0.020%), Potawatomi (27.0%, a difference of 0.050%), Immigrants from Dominican Republic (27.0%, a difference of 0.080%), Immigrants from Mexico (27.1%, a difference of 0.40%), and Central American Indian (27.1%, a difference of 0.41%).
| Demographics | Rating | Rank | Disability Age 65 to 74 |
| Immigrants | Cabo Verde | 0.0 /100 | #290 | Tragic 26.3% |
| Spanish American Indians | 0.0 /100 | #291 | Tragic 26.4% |
| Blackfeet | 0.0 /100 | #292 | Tragic 26.6% |
| Immigrants | Central America | 0.0 /100 | #293 | Tragic 26.6% |
| Dominicans | 0.0 /100 | #294 | Tragic 26.7% |
| Hispanics or Latinos | 0.0 /100 | #295 | Tragic 26.7% |
| Bangladeshis | 0.0 /100 | #296 | Tragic 26.8% |
| Fijians | 0.0 /100 | #297 | Tragic 27.0% |
| Immigrants | Yemen | 0.0 /100 | #298 | Tragic 27.0% |
| Potawatomi | 0.0 /100 | #299 | Tragic 27.0% |
| Immigrants | Dominican Republic | 0.0 /100 | #300 | Tragic 27.0% |
| Immigrants | Mexico | 0.0 /100 | #301 | Tragic 27.1% |
| Central American Indians | 0.0 /100 | #302 | Tragic 27.1% |
| Tlingit-Haida | 0.0 /100 | #303 | Tragic 27.1% |
| Puget Sound Salish | 0.0 /100 | #304 | Tragic 27.2% |