Thai vs Immigrants from Poland Hearing Disability

COMPARE

Thai
Race
Ancestry
AfghanAfricanAlaska NativeAlaskan AthabascanAlbanianAleutAlsatianAmericanApacheArabArapahoArgentineanArmenianAssyrian/Chaldean/SyriacAustralianAustrianBahamianBangladeshiBarbadianBasqueBelgianBelizeanBermudanBhutaneseBlackfeetBolivianBrazilianBritishBritish West IndianBulgarianBurmeseCajunCambodianCanadianCape VerdeanCarpatho RusynCelticCentral AmericanCentral American IndianCherokeeCheyenneChickasawChileanChineseChippewaChoctawColombianColvilleComancheCosta RicanCreeCreekCroatianCrowCubanCypriotCzechCzechoslovakianDanishDelawareDominicanDutchDutch West IndianEastern EuropeanEcuadorianEgyptianEnglishEstonianEthiopianEuropeanFijianFilipinoFinnishFrenchFrench American IndianFrench CanadianGermanGerman RussianGhanaianGreekGuamanian/ChamorroGuatemalanGuyaneseHaitianHmongHonduranHopiHoumaHungarianIcelanderIndian (Asian)IndonesianInupiatIranianIraqiIrishIroquoisIsraeliItalianJamaicanJapaneseJordanianKenyanKiowaKoreanLaotianLatvianLebaneseLiberianLithuanianLumbeeLuxembourgerMacedonianMalaysianMalteseMarshalleseMenomineeMexicanMexican American IndianMongolianMoroccanNative HawaiianNavajoNepaleseNew ZealanderNicaraguanNigerianNorthern EuropeanNorwegianOkinawanOsageOttawaPaiutePakistaniPalestinianPanamanianParaguayanPennsylvania GermanPeruvianPimaPolishPortuguesePotawatomiPuebloPuerto RicanPuget Sound SalishRomanianRussianSalvadoranSamoanScandinavianScotch-IrishScottishSeminoleSenegaleseSerbianShoshoneSierra LeoneanSiouxSlavicSlovakSloveneSomaliSouth AfricanSouth AmericanSouth American IndianSoviet UnionSpaniardSpanishSpanish AmericanSpanish American IndianSri LankanSubsaharan AfricanSudaneseSwedishSwissSyrianTaiwaneseThaiTlingit-HaidaTohono O'OdhamTonganTrinidadian and TobagonianTsimshianTurkishU.S. Virgin IslanderUgandanUkrainianUruguayanUteVenezuelanVietnameseWelshWest IndianYakamaYaquiYugoslavianYumanYup'ikZimbabwean
Immigration
NonimmigrantsImmigrantsAfghanistanAfricaAlbaniaArgentinaArmeniaAsiaAustraliaAustriaBahamasBangladeshBarbadosBelarusBelgiumBelizeBoliviaBosnia and HerzegovinaBrazilBulgariaBurma/MyanmarCabo VerdeCambodiaCameroonCanadaCaribbeanCentral AmericaChileChinaColombiaCongoCosta RicaCroatiaCubaCzechoslovakiaDenmarkDominicaDominican RepublicEastern AfricaEastern AsiaEastern EuropeEcuadorEgyptEl SalvadorEnglandEritreaEthiopiaEuropeFijiFranceGermanyGhanaGreeceGrenadaGuatemalaGuyanaHaitiHondurasHong KongHungaryIndiaIndonesiaIranIraqIrelandIsraelItalyJamaicaJapanJordanKazakhstanKenyaKoreaKuwaitLaosLatin AmericaLatviaLebanonLiberiaLithuaniaMalaysiaMexicoMicronesiaMiddle AfricaMoldovaMoroccoNepalNetherlandsNicaraguaNigeriaNorth AmericaNorth MacedoniaNorthern AfricaNorthern EuropeNorwayOceaniaPakistanPanamaPeruPhilippinesPortugalRomaniaRussiaSaudi ArabiaScotlandSenegalSerbiaSierra LeoneSingaporeSomaliaSouth AfricaSouth AmericaSouth Central AsiaSouth Eastern AsiaSouthern EuropeSpainSri LankaSt. Vincent and the GrenadinesSudanSwedenSwitzerlandSyriaTaiwanThailandTrinidad and TobagoTurkeyUgandaUkraineUruguayUzbekistanVenezuelaVietnamWest IndiesWestern AfricaWestern AsiaWestern EuropeYemenZaireZimbabweAzores
Immigrants from Poland
Race
Ancestry
AfghanAfricanAlaska NativeAlaskan AthabascanAlbanianAleutAlsatianAmericanApacheArabArapahoArgentineanArmenianAssyrian/Chaldean/SyriacAustralianAustrianBahamianBangladeshiBarbadianBasqueBelgianBelizeanBermudanBhutaneseBlackfeetBolivianBrazilianBritishBritish West IndianBulgarianBurmeseCajunCambodianCanadianCape VerdeanCarpatho RusynCelticCentral AmericanCentral American IndianCherokeeCheyenneChickasawChileanChineseChippewaChoctawColombianColvilleComancheCosta RicanCreeCreekCroatianCrowCubanCypriotCzechCzechoslovakianDanishDelawareDominicanDutchDutch West IndianEastern EuropeanEcuadorianEgyptianEnglishEstonianEthiopianEuropeanFijianFilipinoFinnishFrenchFrench American IndianFrench CanadianGermanGerman RussianGhanaianGreekGuamanian/ChamorroGuatemalanGuyaneseHaitianHmongHonduranHopiHoumaHungarianIcelanderIndian (Asian)IndonesianInupiatIranianIraqiIrishIroquoisIsraeliItalianJamaicanJapaneseJordanianKenyanKiowaKoreanLaotianLatvianLebaneseLiberianLithuanianLumbeeLuxembourgerMacedonianMalaysianMalteseMarshalleseMenomineeMexicanMexican American IndianMongolianMoroccanNative HawaiianNavajoNepaleseNew ZealanderNicaraguanNigerianNorthern EuropeanNorwegianOkinawanOsageOttawaPaiutePakistaniPalestinianPanamanianParaguayanPennsylvania GermanPeruvianPimaPolishPortuguesePotawatomiPuebloPuerto RicanPuget Sound SalishRomanianRussianSalvadoranSamoanScandinavianScotch-IrishScottishSeminoleSenegaleseSerbianShoshoneSierra LeoneanSiouxSlavicSlovakSloveneSomaliSouth AfricanSouth AmericanSouth American IndianSoviet UnionSpaniardSpanishSpanish AmericanSpanish American IndianSri LankanSubsaharan AfricanSudaneseSwedishSwissSyrianTaiwaneseTlingit-HaidaTohono O'OdhamTonganTrinidadian and TobagonianTsimshianTurkishU.S. Virgin IslanderUgandanUkrainianUruguayanUteVenezuelanVietnameseWelshWest IndianYakamaYaquiYugoslavianYumanYup'ikZimbabwean
Immigration
NonimmigrantsImmigrantsAfghanistanAfricaAlbaniaArgentinaArmeniaAsiaAustraliaAustriaBahamasBangladeshBarbadosBelarusBelgiumBelizeBoliviaBosnia and HerzegovinaBrazilBulgariaBurma/MyanmarCabo VerdeCambodiaCameroonCanadaCaribbeanCentral AmericaChileChinaColombiaCongoCosta RicaCroatiaCubaCzechoslovakiaDenmarkDominicaDominican RepublicEastern AfricaEastern AsiaEastern EuropeEcuadorEgyptEl SalvadorEnglandEritreaEthiopiaEuropeFijiFranceGermanyGhanaGreeceGrenadaGuatemalaGuyanaHaitiHondurasHong KongHungaryIndiaIndonesiaIranIraqIrelandIsraelItalyJamaicaJapanJordanKazakhstanKenyaKoreaKuwaitLaosLatin AmericaLatviaLebanonLiberiaLithuaniaMalaysiaMexicoMicronesiaMiddle AfricaMoldovaMoroccoNepalNetherlandsNicaraguaNigeriaNorth AmericaNorth MacedoniaNorthern AfricaNorthern EuropeNorwayOceaniaPakistanPanamaPeruPhilippinesPolandPortugalRomaniaRussiaSaudi ArabiaScotlandSenegalSerbiaSierra LeoneSingaporeSomaliaSouth AfricaSouth AmericaSouth Central AsiaSouth Eastern AsiaSouthern EuropeSpainSri LankaSt. Vincent and the GrenadinesSudanSwedenSwitzerlandSyriaTaiwanThailandTrinidad and TobagoTurkeyUgandaUkraineUruguayUzbekistanVenezuelaVietnamWest IndiesWestern AfricaWestern AsiaWestern EuropeYemenZaireZimbabweAzores
Hearing Disability
Income
Poverty
Unemployment
Labor Participation
Family Structure
Vehicle Availability
Education Level
Disability

Hearing Disability Comparison

Thais

Immigrants from Poland

Exceptional
Good
2.5%
HEARING DISABILITY
99.8/ 100
METRIC RATING
19th/ 347
METRIC RANK
2.9%
HEARING DISABILITY
70.2/ 100
METRIC RATING
156th/ 347
METRIC RANK

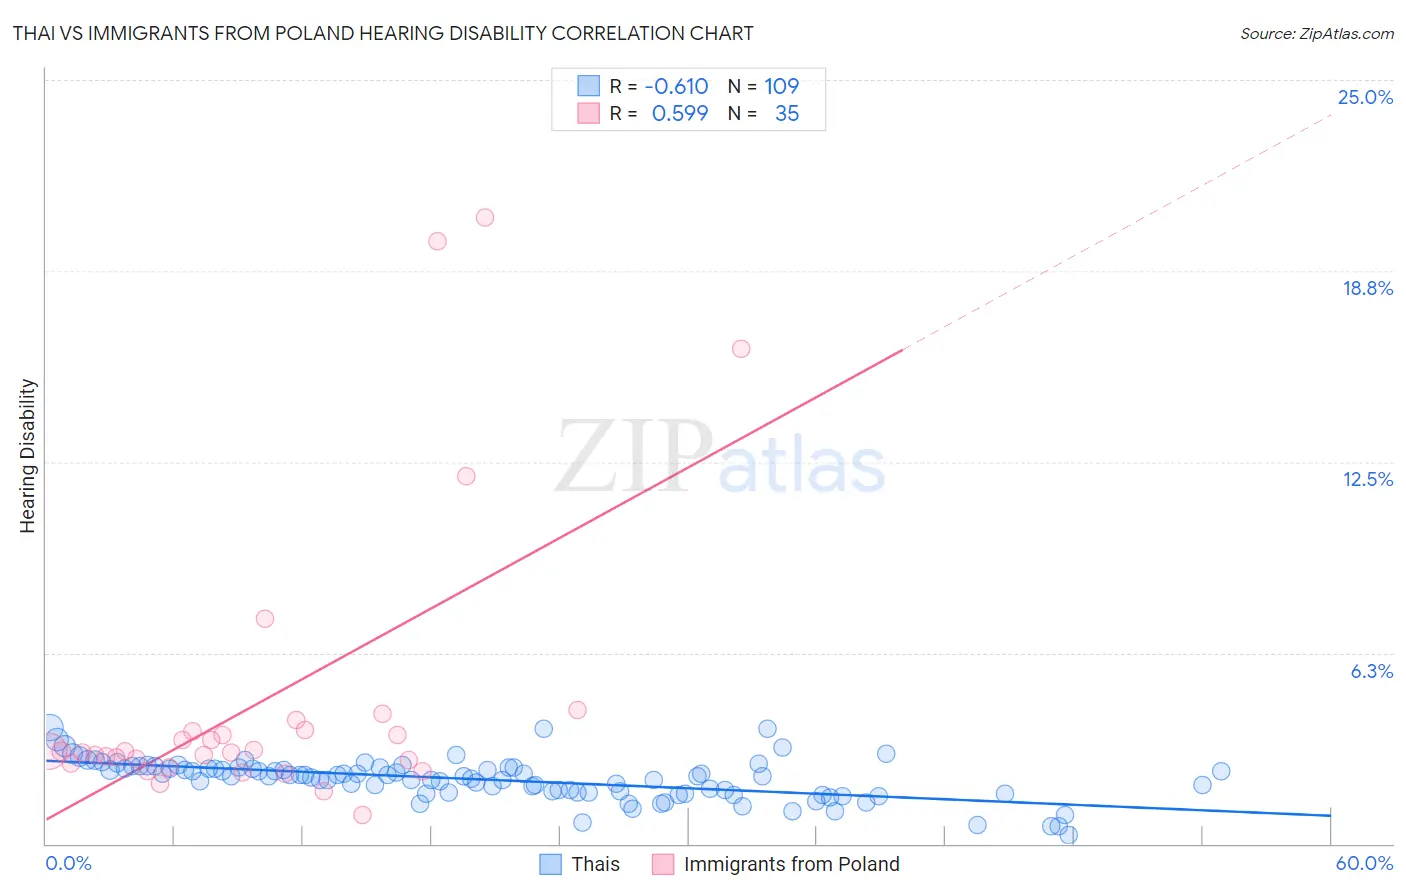
Thai vs Immigrants from Poland Hearing Disability Correlation Chart

The statistical analysis conducted on geographies consisting of 475,566,624 people shows a significant negative correlation between the proportion of Thais and percentage of population with hearing disability in the United States with a correlation coefficient (R) of -0.610 and weighted average of 2.5%. Similarly, the statistical analysis conducted on geographies consisting of 304,813,024 people shows a substantial positive correlation between the proportion of Immigrants from Poland and percentage of population with hearing disability in the United States with a correlation coefficient (R) of 0.599 and weighted average of 2.9%, a difference of 15.2%.
Thai vs Immigrants from Poland Hearing Disability

Hearing Disability Correlation Summary

MeasurementThaiImmigrants from Poland
Minimum0.30%0.95%
Maximum3.8%20.5%
Range3.5%19.6%
Mean2.1%4.7%
Median2.2%3.0%
Interquartile 25% (IQ1)1.7%2.6%
Interquartile 75% (IQ3)2.5%3.7%
Interquartile Range (IQR)0.79%1.1%
Standard Deviation (Sample)0.65%4.8%
Standard Deviation (Population)0.65%4.7%

Similar Demographics by Hearing Disability

Demographics Similar to Thais by Hearing Disability

In terms of hearing disability, the demographic groups most similar to Thais are Dominican (2.5%, a difference of 0.030%), Immigrants from Bolivia (2.5%, a difference of 0.050%), Ghanaian (2.5%, a difference of 0.11%), Immigrants from Sierra Leone (2.6%, a difference of 0.16%), and Immigrants from Nigeria (2.6%, a difference of 0.65%).
DemographicsRating | RankHearing Disability
Trinidadians and Tobagonians
99.9
/100
|
#12
Exceptional
2.5%
Sierra Leoneans
99.9
/100
|
#13
Exceptional
2.5%
Ecuadorians
99.9
/100
|
#14
Exceptional
2.5%
Barbadians
99.9
/100
|
#15
Exceptional
2.5%
Immigrants | West Indies
99.9
/100
|
#16
Exceptional
2.5%
Immigrants | India
99.9
/100
|
#17
Exceptional
2.5%
Dominicans
99.8
/100
|
#18
Exceptional
2.5%
Thais
99.8
/100
|
#19
Exceptional
2.5%
Immigrants | Bolivia
99.8
/100
|
#20
Exceptional
2.5%
Ghanaians
99.8
/100
|
#21
Exceptional
2.5%
Immigrants | Sierra Leone
99.8
/100
|
#22
Exceptional
2.6%
Immigrants | Nigeria
99.8
/100
|
#23
Exceptional
2.6%
Immigrants | Ghana
99.8
/100
|
#24
Exceptional
2.6%
Immigrants | El Salvador
99.7
/100
|
#25
Exceptional
2.6%
Immigrants | Senegal
99.7
/100
|
#26
Exceptional
2.6%

Demographics Similar to Immigrants from Poland by Hearing Disability

In terms of hearing disability, the demographic groups most similar to Immigrants from Poland are Immigrants from Kazakhstan (2.9%, a difference of 0.070%), Immigrants from Burma/Myanmar (2.9%, a difference of 0.080%), Costa Rican (2.9%, a difference of 0.14%), Immigrants from Lebanon (2.9%, a difference of 0.15%), and Sudanese (2.9%, a difference of 0.23%).
DemographicsRating | RankHearing Disability
Immigrants | Panama
76.9
/100
|
#149
Good
2.9%
Palestinians
73.6
/100
|
#150
Good
2.9%
Immigrants | France
73.1
/100
|
#151
Good
2.9%
Immigrants | Lithuania
73.0
/100
|
#152
Good
2.9%
Sudanese
72.1
/100
|
#153
Good
2.9%
Immigrants | Lebanon
71.5
/100
|
#154
Good
2.9%
Costa Ricans
71.4
/100
|
#155
Good
2.9%
Immigrants | Poland
70.2
/100
|
#156
Good
2.9%
Immigrants | Kazakhstan
69.6
/100
|
#157
Good
2.9%
Immigrants | Burma/Myanmar
69.5
/100
|
#158
Good
2.9%
Immigrants | Australia
67.4
/100
|
#159
Good
2.9%
Immigrants | Fiji
67.1
/100
|
#160
Good
2.9%
Albanians
66.6
/100
|
#161
Good
2.9%
Immigrants | Japan
66.3
/100
|
#162
Good
2.9%
Immigrants | Central America
64.9
/100
|
#163
Good
3.0%