Thai vs Aleut Ambulatory Disability
COMPARE
Thai
Aleut
Ambulatory Disability
Ambulatory Disability Comparison
Thais
Aleuts
4.9%
AMBULATORY DISABILITY
100.0/ 100
METRIC RATING
3rd/ 347
METRIC RANK
6.6%
AMBULATORY DISABILITY
0.4/ 100
METRIC RATING
259th/ 347
METRIC RANK
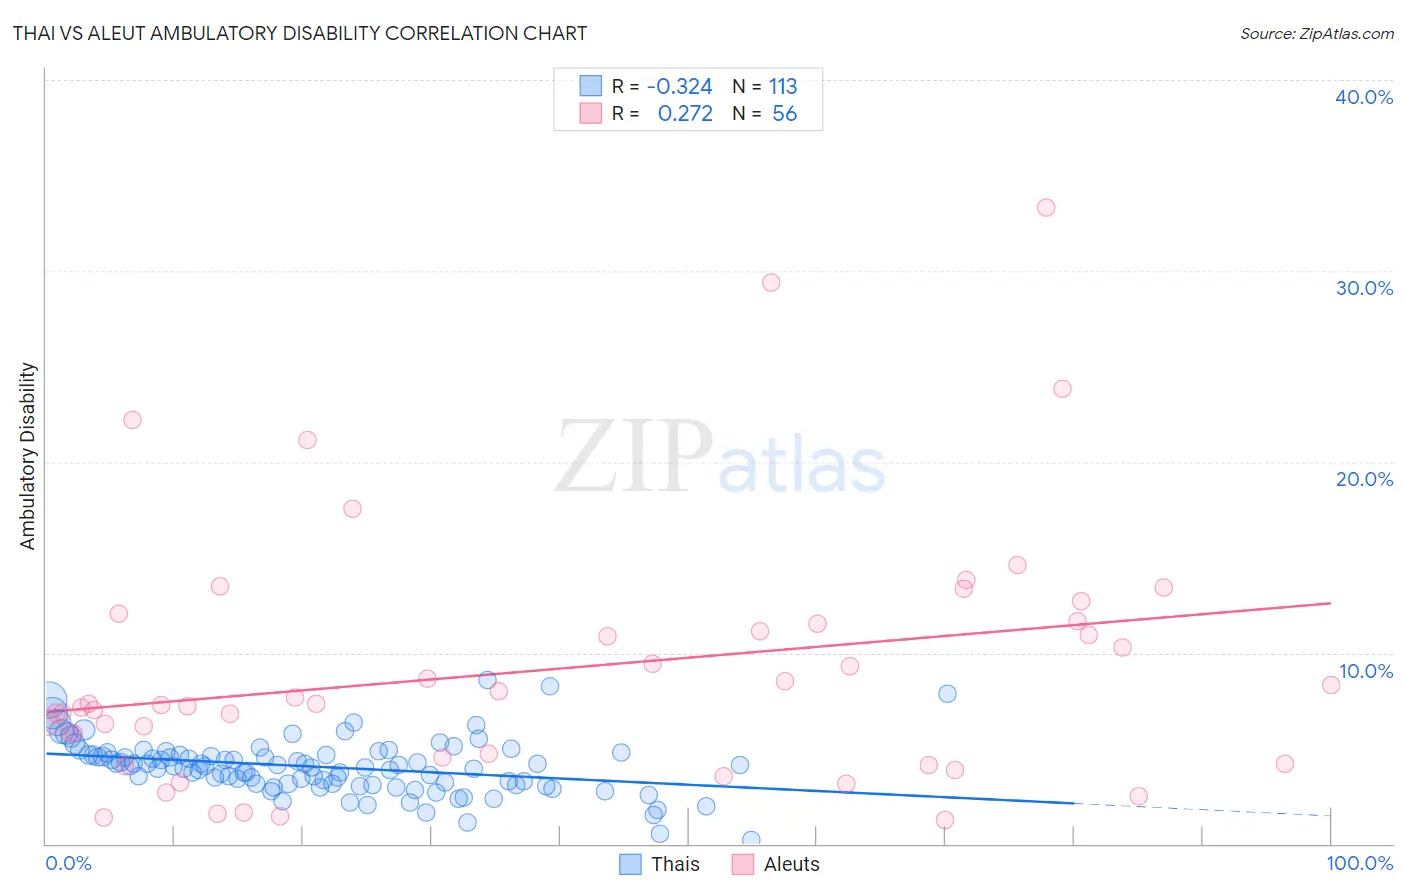
Thai vs Aleut Ambulatory Disability Correlation Chart
The statistical analysis conducted on geographies consisting of 475,631,146 people shows a mild negative correlation between the proportion of Thais and percentage of population with ambulatory disability in the United States with a correlation coefficient (R) of -0.324 and weighted average of 4.9%. Similarly, the statistical analysis conducted on geographies consisting of 61,775,810 people shows a weak positive correlation between the proportion of Aleuts and percentage of population with ambulatory disability in the United States with a correlation coefficient (R) of 0.272 and weighted average of 6.6%, a difference of 33.2%.
Ambulatory Disability Correlation Summary
| Measurement | Thai | Aleut |
| Minimum | 0.18% | 1.2% |
| Maximum | 8.6% | 33.3% |
| Range | 8.4% | 32.1% |
| Mean | 4.0% | 9.1% |
| Median | 4.1% | 7.3% |
| Interquartile 25% (IQ1) | 3.1% | 4.4% |
| Interquartile 75% (IQ3) | 4.7% | 11.6% |
| Interquartile Range (IQR) | 1.5% | 7.2% |
| Standard Deviation (Sample) | 1.4% | 6.7% |
| Standard Deviation (Population) | 1.4% | 6.6% |
Similar Demographics by Ambulatory Disability
Demographics Similar to Thais by Ambulatory Disability
In terms of ambulatory disability, the demographic groups most similar to Thais are Immigrants from Taiwan (4.9%, a difference of 0.24%), Filipino (4.9%, a difference of 1.2%), Immigrants from Singapore (5.0%, a difference of 1.6%), Immigrants from Bolivia (5.0%, a difference of 2.3%), and Bolivian (5.1%, a difference of 2.7%).
| Demographics | Rating | Rank | Ambulatory Disability |
| Immigrants | India | 100.0 /100 | #1 | Exceptional 4.8% |
| Filipinos | 100.0 /100 | #2 | Exceptional 4.9% |
| Thais | 100.0 /100 | #3 | Exceptional 4.9% |
| Immigrants | Taiwan | 100.0 /100 | #4 | Exceptional 4.9% |
| Immigrants | Singapore | 100.0 /100 | #5 | Exceptional 5.0% |
| Immigrants | Bolivia | 100.0 /100 | #6 | Exceptional 5.0% |
| Bolivians | 100.0 /100 | #7 | Exceptional 5.1% |
| Immigrants | South Central Asia | 100.0 /100 | #8 | Exceptional 5.1% |
| Iranians | 100.0 /100 | #9 | Exceptional 5.1% |
| Yup'ik | 100.0 /100 | #10 | Exceptional 5.2% |
| Immigrants | Korea | 100.0 /100 | #11 | Exceptional 5.2% |
| Okinawans | 100.0 /100 | #12 | Exceptional 5.3% |
| Burmese | 100.0 /100 | #13 | Exceptional 5.3% |
| Immigrants | Eastern Asia | 100.0 /100 | #14 | Exceptional 5.3% |
| Immigrants | China | 100.0 /100 | #15 | Exceptional 5.3% |
Demographics Similar to Aleuts by Ambulatory Disability
In terms of ambulatory disability, the demographic groups most similar to Aleuts are Immigrants from Belize (6.6%, a difference of 0.010%), Irish (6.6%, a difference of 0.080%), Spanish American Indian (6.5%, a difference of 0.18%), English (6.6%, a difference of 0.25%), and Bermudan (6.5%, a difference of 0.26%).
| Demographics | Rating | Rank | Ambulatory Disability |
| Immigrants | Bahamas | 0.8 /100 | #252 | Tragic 6.5% |
| Scottish | 0.7 /100 | #253 | Tragic 6.5% |
| Belizeans | 0.7 /100 | #254 | Tragic 6.5% |
| Welsh | 0.6 /100 | #255 | Tragic 6.5% |
| Immigrants | Uzbekistan | 0.6 /100 | #256 | Tragic 6.5% |
| Bermudans | 0.5 /100 | #257 | Tragic 6.5% |
| Spanish American Indians | 0.5 /100 | #258 | Tragic 6.5% |
| Aleuts | 0.4 /100 | #259 | Tragic 6.6% |
| Immigrants | Belize | 0.4 /100 | #260 | Tragic 6.6% |
| Irish | 0.4 /100 | #261 | Tragic 6.6% |
| English | 0.4 /100 | #262 | Tragic 6.6% |
| Hmong | 0.3 /100 | #263 | Tragic 6.6% |
| Nepalese | 0.2 /100 | #264 | Tragic 6.6% |
| Bahamians | 0.2 /100 | #265 | Tragic 6.6% |
| Guyanese | 0.2 /100 | #266 | Tragic 6.6% |