Sudanese vs German Disability Age Over 75
COMPARE
Sudanese
German
Disability Age Over 75
Disability Age Over 75 Comparison
Sudanese
Germans
47.5%
DISABILITY AGE OVER 75
32.0/ 100
METRIC RATING
186th/ 347
METRIC RANK
46.3%
DISABILITY AGE OVER 75
98.2/ 100
METRIC RATING
92nd/ 347
METRIC RANK
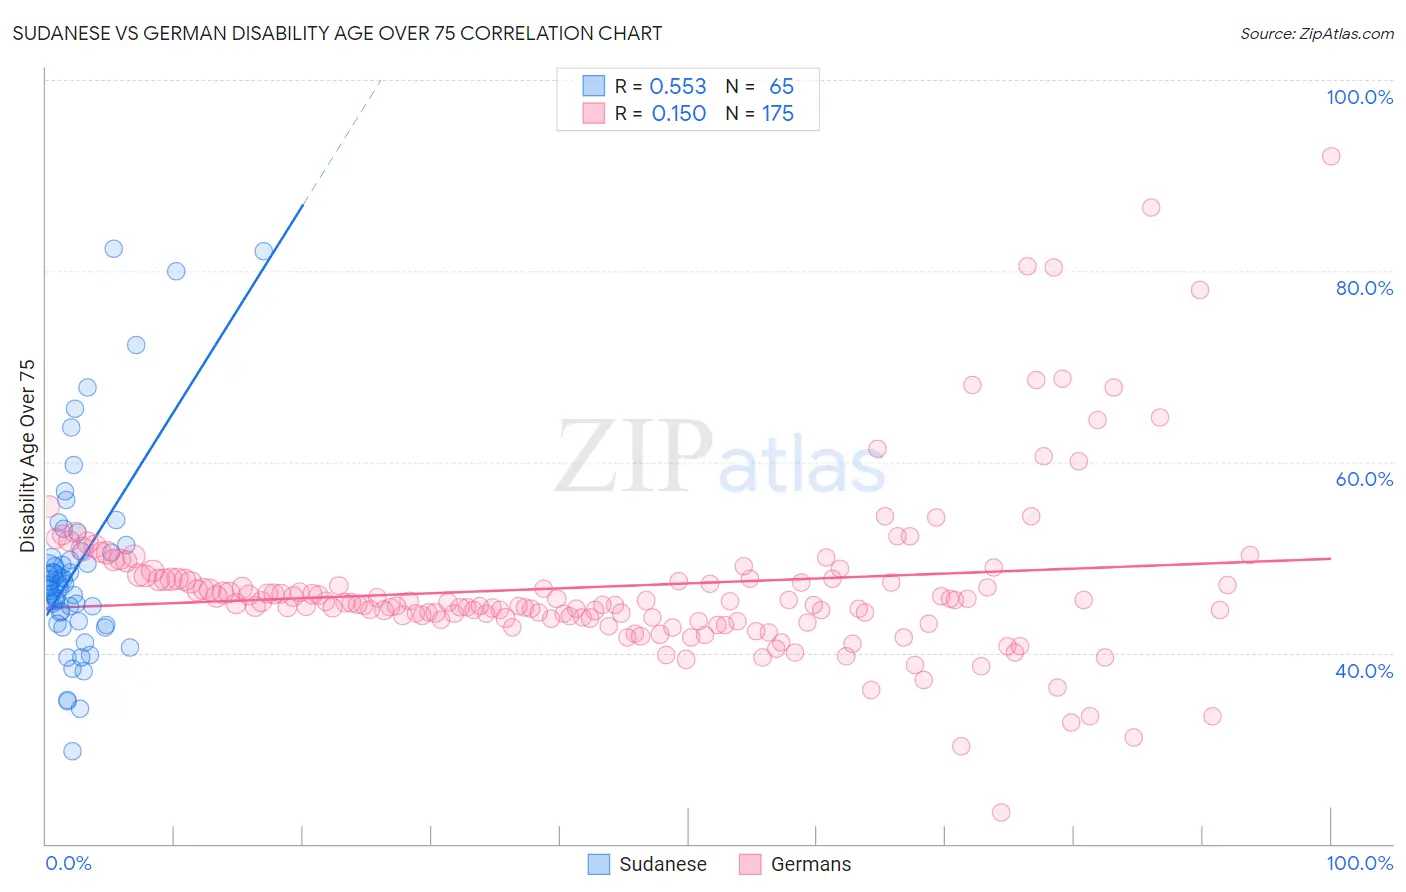
Sudanese vs German Disability Age Over 75 Correlation Chart
The statistical analysis conducted on geographies consisting of 110,068,625 people shows a substantial positive correlation between the proportion of Sudanese and percentage of population with a disability over the age of 75 in the United States with a correlation coefficient (R) of 0.553 and weighted average of 47.5%. Similarly, the statistical analysis conducted on geographies consisting of 578,361,531 people shows a poor positive correlation between the proportion of Germans and percentage of population with a disability over the age of 75 in the United States with a correlation coefficient (R) of 0.150 and weighted average of 46.3%, a difference of 2.7%.
Disability Age Over 75 Correlation Summary
| Measurement | Sudanese | German |
| Minimum | 29.7% | 23.2% |
| Maximum | 82.4% | 92.0% |
| Range | 52.6% | 68.8% |
| Mean | 49.0% | 47.0% |
| Median | 47.3% | 45.2% |
| Interquartile 25% (IQ1) | 43.8% | 43.6% |
| Interquartile 75% (IQ3) | 50.6% | 47.8% |
| Interquartile Range (IQR) | 6.8% | 4.1% |
| Standard Deviation (Sample) | 10.4% | 8.9% |
| Standard Deviation (Population) | 10.3% | 8.9% |
Similar Demographics by Disability Age Over 75
Demographics Similar to Sudanese by Disability Age Over 75
In terms of disability age over 75, the demographic groups most similar to Sudanese are Immigrants from Sudan (47.5%, a difference of 0.010%), Ghanaian (47.5%, a difference of 0.030%), Basque (47.6%, a difference of 0.030%), Immigrants from Kenya (47.6%, a difference of 0.030%), and Immigrants from Nigeria (47.5%, a difference of 0.050%).
| Demographics | Rating | Rank | Disability Age Over 75 |
| Sierra Leoneans | 41.7 /100 | #179 | Average 47.4% |
| Immigrants | Ecuador | 41.7 /100 | #180 | Average 47.4% |
| Immigrants | Kazakhstan | 40.4 /100 | #181 | Average 47.4% |
| Immigrants | Moldova | 39.9 /100 | #182 | Fair 47.4% |
| Delaware | 39.1 /100 | #183 | Fair 47.5% |
| Immigrants | Nigeria | 34.0 /100 | #184 | Fair 47.5% |
| Ghanaians | 33.0 /100 | #185 | Fair 47.5% |
| Sudanese | 32.0 /100 | #186 | Fair 47.5% |
| Immigrants | Sudan | 31.8 /100 | #187 | Fair 47.5% |
| Basques | 30.9 /100 | #188 | Fair 47.6% |
| Immigrants | Kenya | 30.8 /100 | #189 | Fair 47.6% |
| Somalis | 29.5 /100 | #190 | Fair 47.6% |
| Portuguese | 29.3 /100 | #191 | Fair 47.6% |
| Immigrants | Jamaica | 28.3 /100 | #192 | Fair 47.6% |
| Ottawa | 28.1 /100 | #193 | Fair 47.6% |
Demographics Similar to Germans by Disability Age Over 75
In terms of disability age over 75, the demographic groups most similar to Germans are Ugandan (46.3%, a difference of 0.0%), Albanian (46.3%, a difference of 0.040%), Northern European (46.3%, a difference of 0.050%), Immigrants from Egypt (46.3%, a difference of 0.050%), and Immigrants from Brazil (46.3%, a difference of 0.060%).
| Demographics | Rating | Rank | Disability Age Over 75 |
| Immigrants | Southern Europe | 98.6 /100 | #85 | Exceptional 46.2% |
| Romanians | 98.6 /100 | #86 | Exceptional 46.2% |
| Danes | 98.6 /100 | #87 | Exceptional 46.2% |
| Uruguayans | 98.4 /100 | #88 | Exceptional 46.2% |
| Immigrants | Saudi Arabia | 98.4 /100 | #89 | Exceptional 46.3% |
| Northern Europeans | 98.3 /100 | #90 | Exceptional 46.3% |
| Immigrants | Egypt | 98.3 /100 | #91 | Exceptional 46.3% |
| Germans | 98.2 /100 | #92 | Exceptional 46.3% |
| Ugandans | 98.2 /100 | #93 | Exceptional 46.3% |
| Albanians | 98.1 /100 | #94 | Exceptional 46.3% |
| Immigrants | Brazil | 98.0 /100 | #95 | Exceptional 46.3% |
| Immigrants | China | 98.0 /100 | #96 | Exceptional 46.3% |
| Finns | 97.9 /100 | #97 | Exceptional 46.3% |
| Immigrants | Japan | 97.8 /100 | #98 | Exceptional 46.3% |
| Palestinians | 97.7 /100 | #99 | Exceptional 46.3% |