Spanish American vs Immigrants from Southern Europe Cognitive Disability
COMPARE
Spanish American
Immigrants from Southern Europe
Cognitive Disability
Cognitive Disability Comparison
Spanish Americans
Immigrants from Southern Europe
18.0%
COGNITIVE DISABILITY
0.4/ 100
METRIC RATING
265th/ 347
METRIC RANK
16.7%
COGNITIVE DISABILITY
98.7/ 100
METRIC RATING
93rd/ 347
METRIC RANK
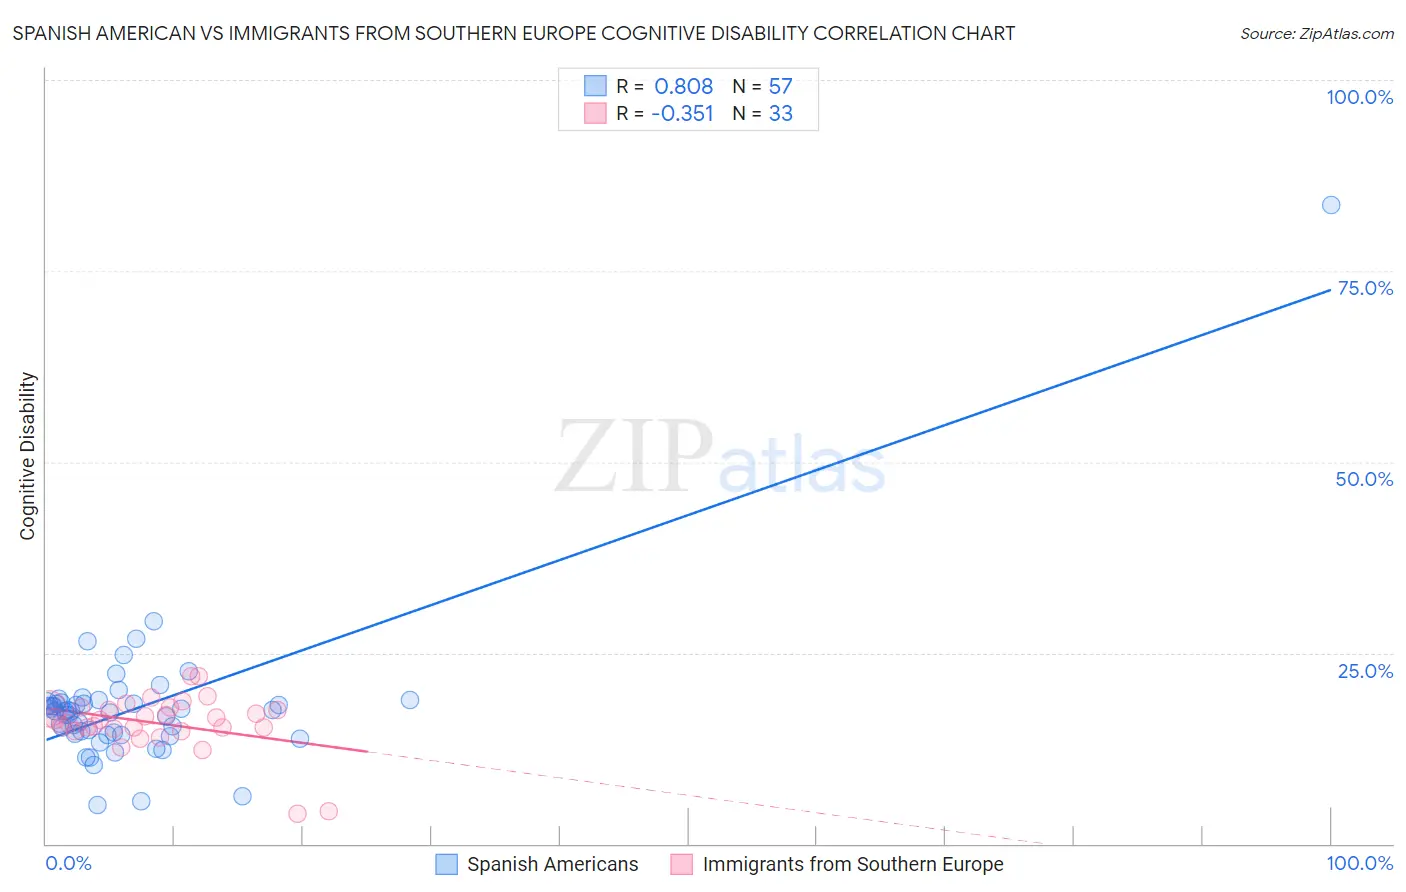
Spanish American vs Immigrants from Southern Europe Cognitive Disability Correlation Chart
The statistical analysis conducted on geographies consisting of 103,167,969 people shows a very strong positive correlation between the proportion of Spanish Americans and percentage of population with cognitive disability in the United States with a correlation coefficient (R) of 0.808 and weighted average of 18.0%. Similarly, the statistical analysis conducted on geographies consisting of 402,774,065 people shows a mild negative correlation between the proportion of Immigrants from Southern Europe and percentage of population with cognitive disability in the United States with a correlation coefficient (R) of -0.351 and weighted average of 16.7%, a difference of 7.3%.
Cognitive Disability Correlation Summary
| Measurement | Spanish American | Immigrants from Southern Europe |
| Minimum | 5.1% | 3.9% |
| Maximum | 83.6% | 21.9% |
| Range | 78.6% | 18.0% |
| Mean | 17.8% | 15.8% |
| Median | 17.4% | 16.3% |
| Interquartile 25% (IQ1) | 14.4% | 14.9% |
| Interquartile 75% (IQ3) | 18.4% | 17.7% |
| Interquartile Range (IQR) | 4.1% | 2.8% |
| Standard Deviation (Sample) | 10.0% | 3.7% |
| Standard Deviation (Population) | 9.9% | 3.7% |
Similar Demographics by Cognitive Disability
Demographics Similar to Spanish Americans by Cognitive Disability
In terms of cognitive disability, the demographic groups most similar to Spanish Americans are Belizean (18.0%, a difference of 0.0%), Menominee (18.0%, a difference of 0.030%), Nepalese (18.0%, a difference of 0.060%), Cherokee (18.0%, a difference of 0.070%), and Immigrants from Barbados (17.9%, a difference of 0.090%).
| Demographics | Rating | Rank | Cognitive Disability |
| Immigrants | Armenia | 0.6 /100 | #258 | Tragic 17.9% |
| Ethiopians | 0.5 /100 | #259 | Tragic 17.9% |
| Immigrants | Belize | 0.5 /100 | #260 | Tragic 17.9% |
| Guamanians/Chamorros | 0.5 /100 | #261 | Tragic 17.9% |
| Sierra Leoneans | 0.4 /100 | #262 | Tragic 17.9% |
| Immigrants | Barbados | 0.4 /100 | #263 | Tragic 17.9% |
| Menominee | 0.4 /100 | #264 | Tragic 18.0% |
| Spanish Americans | 0.4 /100 | #265 | Tragic 18.0% |
| Belizeans | 0.4 /100 | #266 | Tragic 18.0% |
| Nepalese | 0.3 /100 | #267 | Tragic 18.0% |
| Cherokee | 0.3 /100 | #268 | Tragic 18.0% |
| Hondurans | 0.3 /100 | #269 | Tragic 18.0% |
| Immigrants | Bahamas | 0.3 /100 | #270 | Tragic 18.0% |
| Potawatomi | 0.2 /100 | #271 | Tragic 18.0% |
| Immigrants | Honduras | 0.2 /100 | #272 | Tragic 18.0% |
Demographics Similar to Immigrants from Southern Europe by Cognitive Disability
In terms of cognitive disability, the demographic groups most similar to Immigrants from Southern Europe are Immigrants from South America (16.7%, a difference of 0.0%), Immigrants from Egypt (16.7%, a difference of 0.020%), South American (16.7%, a difference of 0.020%), Danish (16.7%, a difference of 0.020%), and Asian (16.7%, a difference of 0.040%).
| Demographics | Rating | Rank | Cognitive Disability |
| Immigrants | South Africa | 99.0 /100 | #86 | Exceptional 16.7% |
| Native Hawaiians | 99.0 /100 | #87 | Exceptional 16.7% |
| Immigrants | Philippines | 99.0 /100 | #88 | Exceptional 16.7% |
| Immigrants | Egypt | 98.8 /100 | #89 | Exceptional 16.7% |
| South Americans | 98.8 /100 | #90 | Exceptional 16.7% |
| Danes | 98.8 /100 | #91 | Exceptional 16.7% |
| Immigrants | South America | 98.8 /100 | #92 | Exceptional 16.7% |
| Immigrants | Southern Europe | 98.7 /100 | #93 | Exceptional 16.7% |
| Asians | 98.7 /100 | #94 | Exceptional 16.7% |
| English | 98.6 /100 | #95 | Exceptional 16.8% |
| Finns | 98.5 /100 | #96 | Exceptional 16.8% |
| Dutch | 98.5 /100 | #97 | Exceptional 16.8% |
| Immigrants | Lebanon | 98.4 /100 | #98 | Exceptional 16.8% |
| Jordanians | 98.2 /100 | #99 | Exceptional 16.8% |
| Immigrants | Russia | 98.2 /100 | #100 | Exceptional 16.8% |