Spanish American vs Immigrants from Liberia Hearing Disability
COMPARE
Spanish American
Immigrants from Liberia
Hearing Disability
Hearing Disability Comparison
Spanish Americans
Immigrants from Liberia
4.0%
HEARING DISABILITY
0.0/ 100
METRIC RATING
316th/ 347
METRIC RANK
2.8%
HEARING DISABILITY
90.0/ 100
METRIC RATING
117th/ 347
METRIC RANK
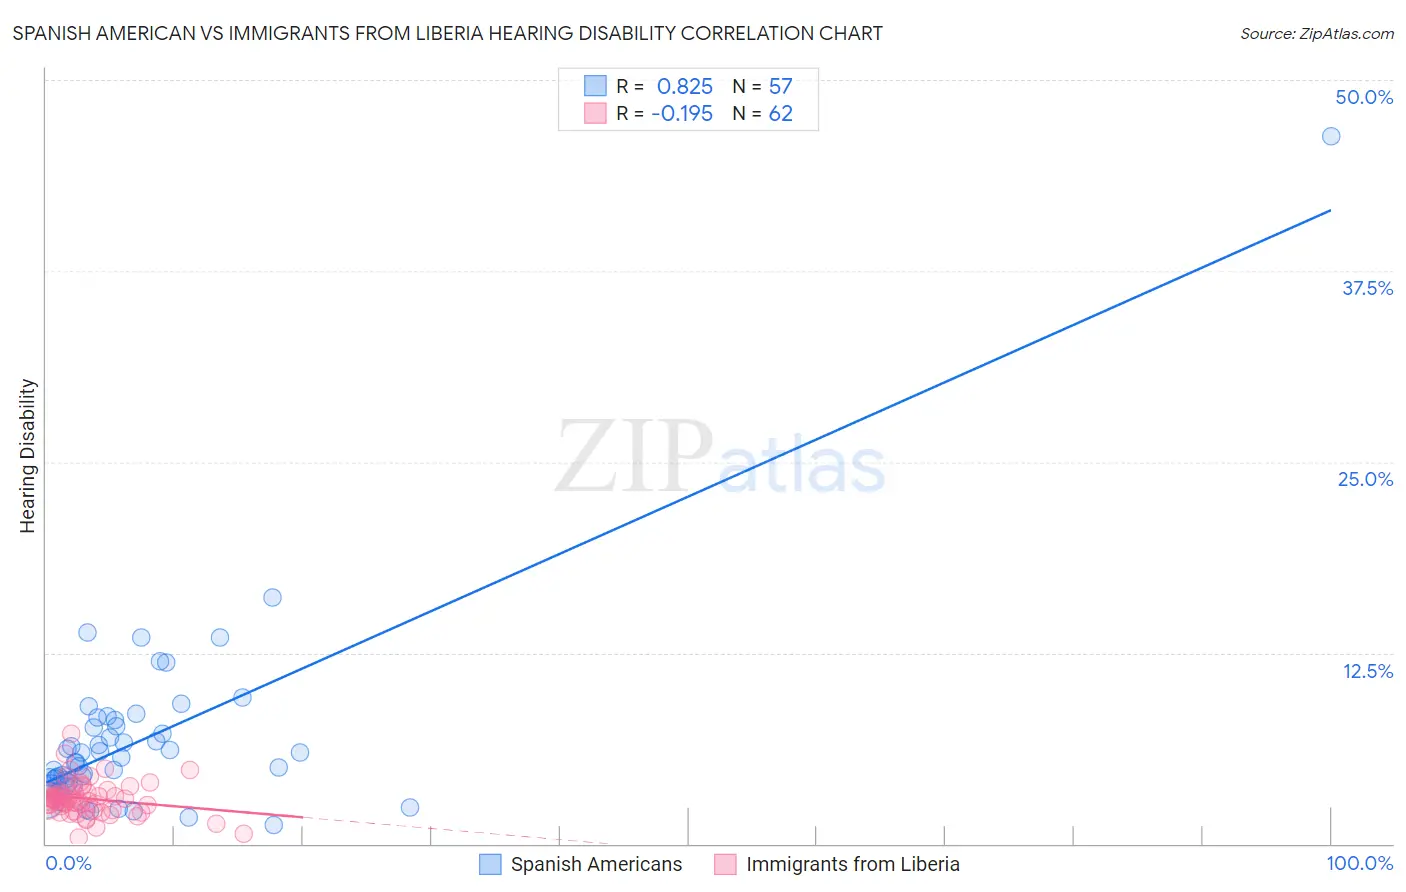
Spanish American vs Immigrants from Liberia Hearing Disability Correlation Chart
The statistical analysis conducted on geographies consisting of 103,164,367 people shows a very strong positive correlation between the proportion of Spanish Americans and percentage of population with hearing disability in the United States with a correlation coefficient (R) of 0.825 and weighted average of 4.0%. Similarly, the statistical analysis conducted on geographies consisting of 135,218,805 people shows a poor negative correlation between the proportion of Immigrants from Liberia and percentage of population with hearing disability in the United States with a correlation coefficient (R) of -0.195 and weighted average of 2.8%, a difference of 39.3%.
Hearing Disability Correlation Summary
| Measurement | Spanish American | Immigrants from Liberia |
| Minimum | 1.3% | 0.44% |
| Maximum | 46.3% | 7.2% |
| Range | 45.0% | 6.7% |
| Mean | 6.8% | 3.0% |
| Median | 5.4% | 2.8% |
| Interquartile 25% (IQ1) | 4.0% | 2.2% |
| Interquartile 75% (IQ3) | 7.9% | 3.3% |
| Interquartile Range (IQR) | 3.9% | 1.1% |
| Standard Deviation (Sample) | 6.3% | 1.1% |
| Standard Deviation (Population) | 6.2% | 1.1% |
Similar Demographics by Hearing Disability
Demographics Similar to Spanish Americans by Hearing Disability
In terms of hearing disability, the demographic groups most similar to Spanish Americans are Comanche (4.0%, a difference of 0.13%), Puget Sound Salish (3.9%, a difference of 0.20%), Yakama (3.9%, a difference of 0.21%), Cheyenne (4.0%, a difference of 0.31%), and Hopi (3.9%, a difference of 0.38%).
| Demographics | Rating | Rank | Hearing Disability |
| Scotch-Irish | 0.0 /100 | #309 | Tragic 3.8% |
| Cree | 0.0 /100 | #310 | Tragic 3.8% |
| Americans | 0.0 /100 | #311 | Tragic 3.9% |
| Cajuns | 0.0 /100 | #312 | Tragic 3.9% |
| Hopi | 0.0 /100 | #313 | Tragic 3.9% |
| Yakama | 0.0 /100 | #314 | Tragic 3.9% |
| Puget Sound Salish | 0.0 /100 | #315 | Tragic 3.9% |
| Spanish Americans | 0.0 /100 | #316 | Tragic 4.0% |
| Comanche | 0.0 /100 | #317 | Tragic 4.0% |
| Cheyenne | 0.0 /100 | #318 | Tragic 4.0% |
| Chippewa | 0.0 /100 | #319 | Tragic 4.0% |
| Shoshone | 0.0 /100 | #320 | Tragic 4.0% |
| Paiute | 0.0 /100 | #321 | Tragic 4.1% |
| Seminole | 0.0 /100 | #322 | Tragic 4.1% |
| Apache | 0.0 /100 | #323 | Tragic 4.1% |
Demographics Similar to Immigrants from Liberia by Hearing Disability
In terms of hearing disability, the demographic groups most similar to Immigrants from Liberia are Zimbabwean (2.8%, a difference of 0.010%), Kenyan (2.8%, a difference of 0.030%), Immigrants (2.8%, a difference of 0.090%), Jordanian (2.8%, a difference of 0.13%), and Immigrants from Latin America (2.8%, a difference of 0.15%).
| Demographics | Rating | Rank | Hearing Disability |
| Cypriots | 92.9 /100 | #110 | Exceptional 2.8% |
| Immigrants | Yemen | 92.7 /100 | #111 | Exceptional 2.8% |
| U.S. Virgin Islanders | 92.5 /100 | #112 | Exceptional 2.8% |
| Immigrants | Belarus | 91.6 /100 | #113 | Exceptional 2.8% |
| Cambodians | 91.1 /100 | #114 | Exceptional 2.8% |
| Immigrants | Latin America | 90.5 /100 | #115 | Exceptional 2.8% |
| Immigrants | Immigrants | 90.3 /100 | #116 | Exceptional 2.8% |
| Immigrants | Liberia | 90.0 /100 | #117 | Excellent 2.8% |
| Zimbabweans | 89.9 /100 | #118 | Excellent 2.8% |
| Kenyans | 89.8 /100 | #119 | Excellent 2.8% |
| Jordanians | 89.5 /100 | #120 | Excellent 2.8% |
| Cubans | 89.4 /100 | #121 | Excellent 2.8% |
| Liberians | 89.0 /100 | #122 | Excellent 2.8% |
| Immigrants | Zaire | 88.6 /100 | #123 | Excellent 2.9% |
| Bahamians | 88.6 /100 | #124 | Excellent 2.9% |