South American vs Immigrants from Philippines Disability Age 18 to 34
COMPARE
South American
Immigrants from Philippines
Disability Age 18 to 34
Disability Age 18 to 34 Comparison
South Americans
Immigrants from Philippines
5.9%
DISABILITY AGE 18 TO 34
99.8/ 100
METRIC RATING
43rd/ 347
METRIC RANK
6.2%
DISABILITY AGE 18 TO 34
97.6/ 100
METRIC RATING
91st/ 347
METRIC RANK
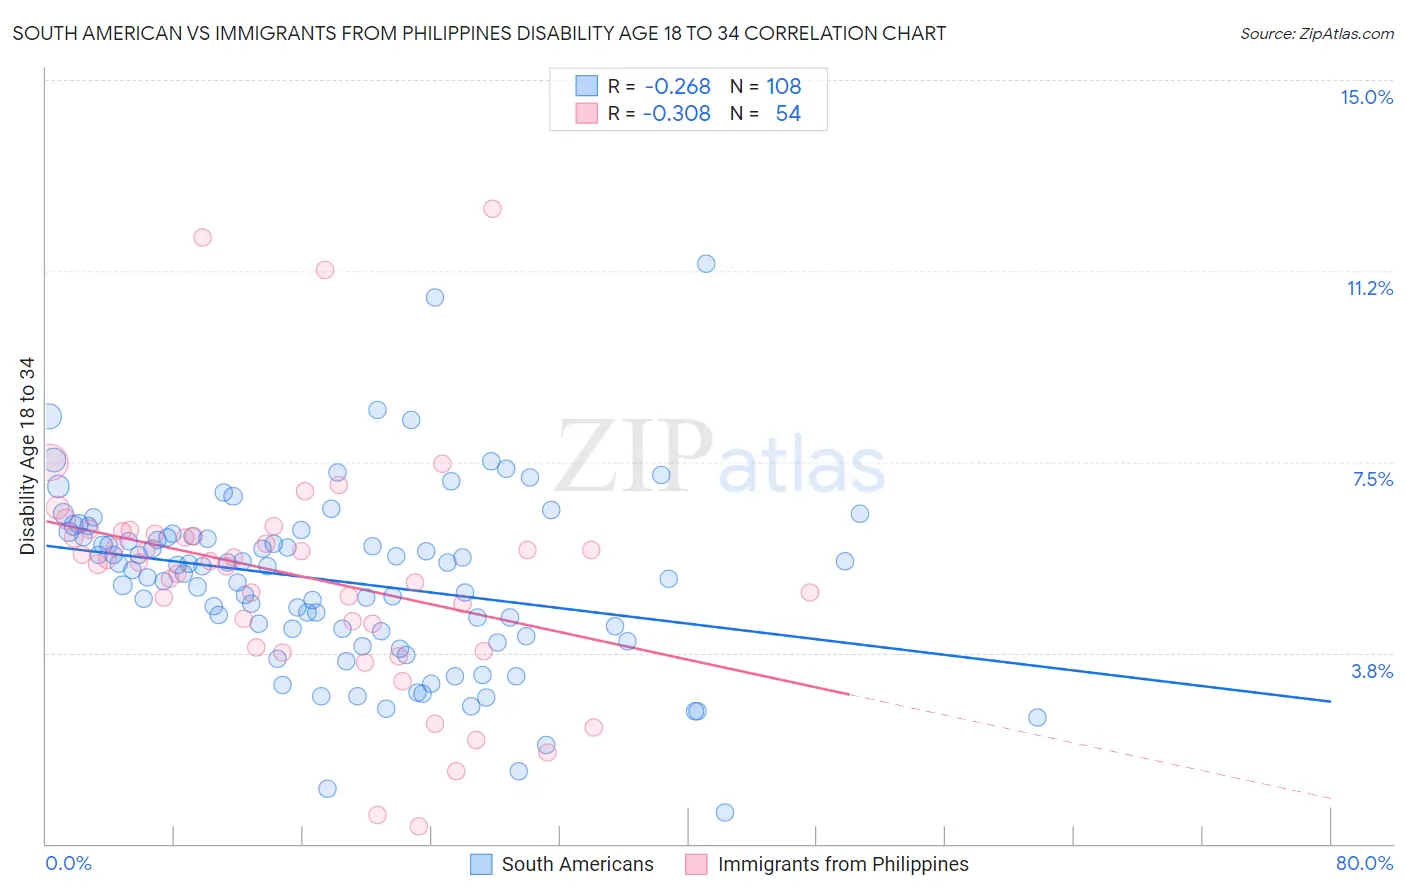
South American vs Immigrants from Philippines Disability Age 18 to 34 Correlation Chart
The statistical analysis conducted on geographies consisting of 492,303,110 people shows a weak negative correlation between the proportion of South Americans and percentage of population with a disability between the ages 18 and 35 in the United States with a correlation coefficient (R) of -0.268 and weighted average of 5.9%. Similarly, the statistical analysis conducted on geographies consisting of 469,762,298 people shows a mild negative correlation between the proportion of Immigrants from Philippines and percentage of population with a disability between the ages 18 and 35 in the United States with a correlation coefficient (R) of -0.308 and weighted average of 6.2%, a difference of 5.4%.
Disability Age 18 to 34 Correlation Summary
| Measurement | South American | Immigrants from Philippines |
| Minimum | 0.61% | 0.34% |
| Maximum | 11.4% | 12.5% |
| Range | 10.8% | 12.1% |
| Mean | 5.2% | 5.3% |
| Median | 5.4% | 5.5% |
| Interquartile 25% (IQ1) | 4.1% | 4.3% |
| Interquartile 75% (IQ3) | 6.0% | 6.1% |
| Interquartile Range (IQR) | 1.9% | 1.8% |
| Standard Deviation (Sample) | 1.8% | 2.3% |
| Standard Deviation (Population) | 1.7% | 2.3% |
Similar Demographics by Disability Age 18 to 34
Demographics Similar to South Americans by Disability Age 18 to 34
In terms of disability age 18 to 34, the demographic groups most similar to South Americans are Colombian (5.9%, a difference of 0.020%), Immigrants from Asia (5.9%, a difference of 0.020%), Immigrants from Peru (5.9%, a difference of 0.15%), Nicaraguan (5.8%, a difference of 0.23%), and Immigrants from Korea (5.9%, a difference of 0.28%).
| Demographics | Rating | Rank | Disability Age 18 to 34 |
| Ecuadorians | 99.9 /100 | #36 | Exceptional 5.8% |
| Armenians | 99.9 /100 | #37 | Exceptional 5.8% |
| Immigrants | South America | 99.9 /100 | #38 | Exceptional 5.8% |
| Asians | 99.9 /100 | #39 | Exceptional 5.8% |
| Bolivians | 99.9 /100 | #40 | Exceptional 5.8% |
| Nicaraguans | 99.9 /100 | #41 | Exceptional 5.8% |
| Colombians | 99.8 /100 | #42 | Exceptional 5.9% |
| South Americans | 99.8 /100 | #43 | Exceptional 5.9% |
| Immigrants | Asia | 99.8 /100 | #44 | Exceptional 5.9% |
| Immigrants | Peru | 99.8 /100 | #45 | Exceptional 5.9% |
| Immigrants | Korea | 99.8 /100 | #46 | Exceptional 5.9% |
| Immigrants | Egypt | 99.8 /100 | #47 | Exceptional 5.9% |
| Immigrants | Trinidad and Tobago | 99.8 /100 | #48 | Exceptional 5.9% |
| Immigrants | Belarus | 99.8 /100 | #49 | Exceptional 5.9% |
| Immigrants | El Salvador | 99.8 /100 | #50 | Exceptional 5.9% |
Demographics Similar to Immigrants from Philippines by Disability Age 18 to 34
In terms of disability age 18 to 34, the demographic groups most similar to Immigrants from Philippines are Jordanian (6.2%, a difference of 0.040%), Immigrants (6.2%, a difference of 0.070%), Immigrants from Vietnam (6.2%, a difference of 0.080%), Turkish (6.2%, a difference of 0.11%), and Immigrants from Kazakhstan (6.2%, a difference of 0.12%).
| Demographics | Rating | Rank | Disability Age 18 to 34 |
| Israelis | 98.3 /100 | #84 | Exceptional 6.1% |
| Immigrants | Ireland | 98.2 /100 | #85 | Exceptional 6.1% |
| Immigrants | Kuwait | 98.0 /100 | #86 | Exceptional 6.2% |
| Immigrants | Eastern Europe | 97.9 /100 | #87 | Exceptional 6.2% |
| Cambodians | 97.8 /100 | #88 | Exceptional 6.2% |
| Turks | 97.8 /100 | #89 | Exceptional 6.2% |
| Immigrants | Vietnam | 97.7 /100 | #90 | Exceptional 6.2% |
| Immigrants | Philippines | 97.6 /100 | #91 | Exceptional 6.2% |
| Jordanians | 97.6 /100 | #92 | Exceptional 6.2% |
| Immigrants | Immigrants | 97.6 /100 | #93 | Exceptional 6.2% |
| Immigrants | Kazakhstan | 97.5 /100 | #94 | Exceptional 6.2% |
| Central Americans | 97.5 /100 | #95 | Exceptional 6.2% |
| Immigrants | Uruguay | 97.4 /100 | #96 | Exceptional 6.2% |
| Uruguayans | 97.3 /100 | #97 | Exceptional 6.2% |
| Immigrants | Syria | 97.2 /100 | #98 | Exceptional 6.2% |