South American vs Immigrants from Ghana Disability Age 65 to 74
COMPARE
South American
Immigrants from Ghana
Disability Age 65 to 74
Disability Age 65 to 74 Comparison
South Americans
Immigrants from Ghana
22.2%
DISABILITY AGE 65 TO 74
96.4/ 100
METRIC RATING
103rd/ 347
METRIC RANK
24.5%
DISABILITY AGE 65 TO 74
3.0/ 100
METRIC RATING
238th/ 347
METRIC RANK
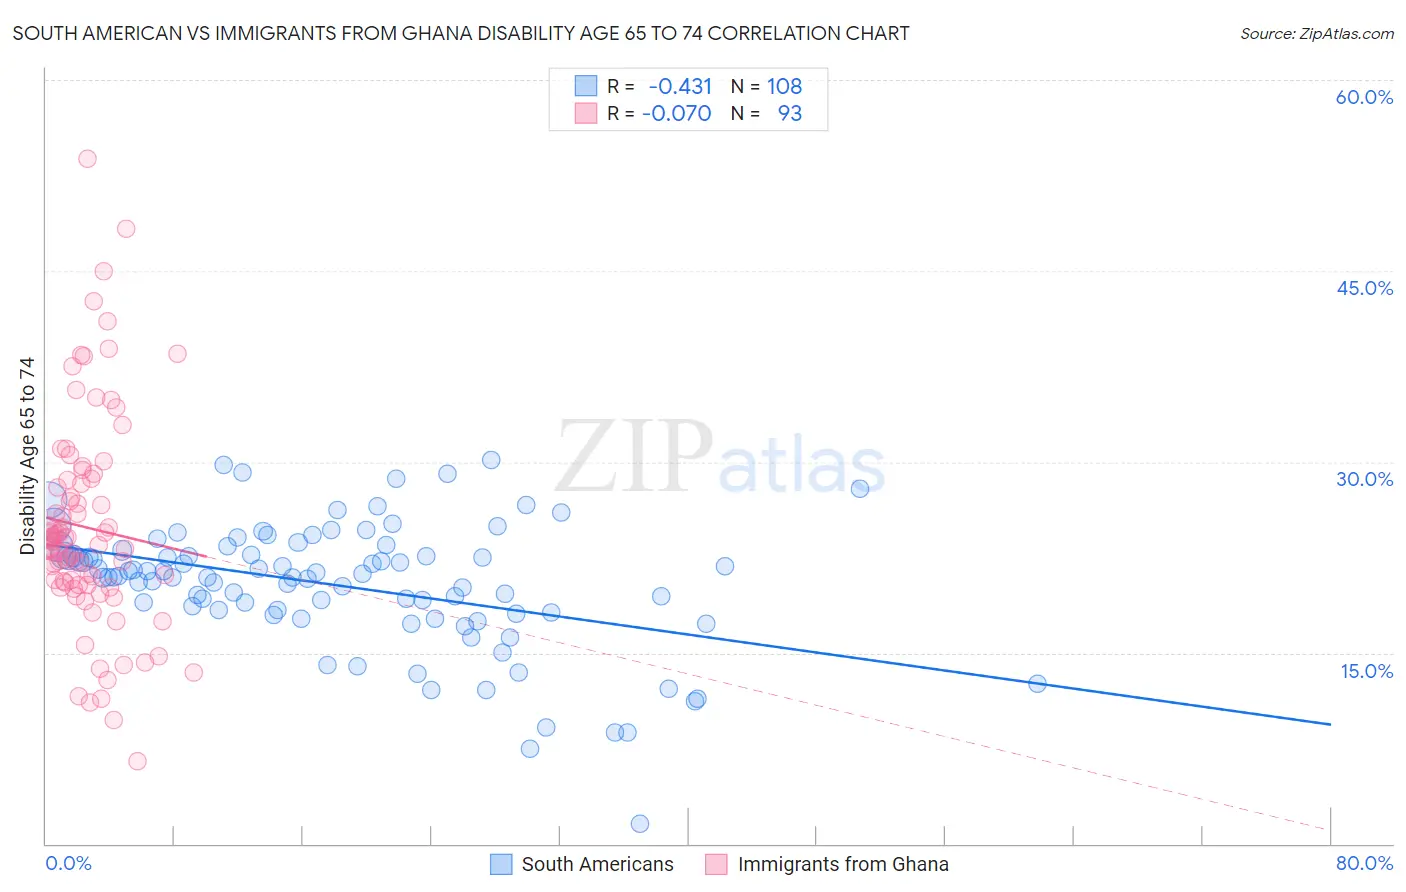
South American vs Immigrants from Ghana Disability Age 65 to 74 Correlation Chart
The statistical analysis conducted on geographies consisting of 492,506,151 people shows a moderate negative correlation between the proportion of South Americans and percentage of population with a disability between the ages 65 and 75 in the United States with a correlation coefficient (R) of -0.431 and weighted average of 22.2%. Similarly, the statistical analysis conducted on geographies consisting of 199,556,575 people shows a slight negative correlation between the proportion of Immigrants from Ghana and percentage of population with a disability between the ages 65 and 75 in the United States with a correlation coefficient (R) of -0.070 and weighted average of 24.5%, a difference of 10.3%.
Disability Age 65 to 74 Correlation Summary
| Measurement | South American | Immigrants from Ghana |
| Minimum | 1.6% | 6.5% |
| Maximum | 30.2% | 53.8% |
| Range | 28.6% | 47.4% |
| Mean | 20.3% | 24.8% |
| Median | 21.0% | 23.8% |
| Interquartile 25% (IQ1) | 18.2% | 20.3% |
| Interquartile 75% (IQ3) | 22.9% | 28.6% |
| Interquartile Range (IQR) | 4.6% | 8.3% |
| Standard Deviation (Sample) | 5.0% | 8.4% |
| Standard Deviation (Population) | 5.0% | 8.4% |
Similar Demographics by Disability Age 65 to 74
Demographics Similar to South Americans by Disability Age 65 to 74
In terms of disability age 65 to 74, the demographic groups most similar to South Americans are Colombian (22.2%, a difference of 0.010%), Immigrants from Saudi Arabia (22.2%, a difference of 0.020%), Immigrants from England (22.2%, a difference of 0.050%), Palestinian (22.2%, a difference of 0.050%), and Uruguayan (22.2%, a difference of 0.060%).
| Demographics | Rating | Rank | Disability Age 65 to 74 |
| Immigrants | North America | 97.5 /100 | #96 | Exceptional 22.1% |
| Immigrants | Southern Europe | 97.2 /100 | #97 | Exceptional 22.1% |
| Jordanians | 96.9 /100 | #98 | Exceptional 22.2% |
| Immigrants | Colombia | 96.8 /100 | #99 | Exceptional 22.2% |
| Uruguayans | 96.5 /100 | #100 | Exceptional 22.2% |
| Immigrants | England | 96.5 /100 | #101 | Exceptional 22.2% |
| Immigrants | Saudi Arabia | 96.4 /100 | #102 | Exceptional 22.2% |
| South Americans | 96.4 /100 | #103 | Exceptional 22.2% |
| Colombians | 96.4 /100 | #104 | Exceptional 22.2% |
| Palestinians | 96.3 /100 | #105 | Exceptional 22.2% |
| Peruvians | 96.1 /100 | #106 | Exceptional 22.2% |
| Slovenes | 96.1 /100 | #107 | Exceptional 22.2% |
| Immigrants | Zimbabwe | 96.1 /100 | #108 | Exceptional 22.3% |
| Albanians | 95.8 /100 | #109 | Exceptional 22.3% |
| Immigrants | Peru | 95.7 /100 | #110 | Exceptional 22.3% |
Demographics Similar to Immigrants from Ghana by Disability Age 65 to 74
In terms of disability age 65 to 74, the demographic groups most similar to Immigrants from Ghana are West Indian (24.5%, a difference of 0.17%), Immigrants from Caribbean (24.6%, a difference of 0.22%), German Russian (24.4%, a difference of 0.27%), Scotch-Irish (24.4%, a difference of 0.31%), and Spaniard (24.6%, a difference of 0.31%).
| Demographics | Rating | Rank | Disability Age 65 to 74 |
| Immigrants | Thailand | 5.2 /100 | #231 | Tragic 24.3% |
| Immigrants | Zaire | 5.0 /100 | #232 | Tragic 24.3% |
| Bahamians | 4.5 /100 | #233 | Tragic 24.4% |
| Panamanians | 4.2 /100 | #234 | Tragic 24.4% |
| Scotch-Irish | 3.8 /100 | #235 | Tragic 24.4% |
| German Russians | 3.7 /100 | #236 | Tragic 24.4% |
| West Indians | 3.4 /100 | #237 | Tragic 24.5% |
| Immigrants | Ghana | 3.0 /100 | #238 | Tragic 24.5% |
| Immigrants | Caribbean | 2.6 /100 | #239 | Tragic 24.6% |
| Spaniards | 2.4 /100 | #240 | Tragic 24.6% |
| Immigrants | Western Africa | 2.3 /100 | #241 | Tragic 24.6% |
| Immigrants | Senegal | 2.2 /100 | #242 | Tragic 24.6% |
| Spanish | 2.2 /100 | #243 | Tragic 24.6% |
| Armenians | 2.0 /100 | #244 | Tragic 24.7% |
| British West Indians | 2.0 /100 | #245 | Tragic 24.7% |