South American vs Bulgarian Hearing Disability
COMPARE
South American
Bulgarian
Hearing Disability
Hearing Disability Comparison
South Americans
Bulgarians
2.7%
HEARING DISABILITY
99.0/ 100
METRIC RATING
57th/ 347
METRIC RANK
3.0%
HEARING DISABILITY
39.7/ 100
METRIC RATING
183rd/ 347
METRIC RANK
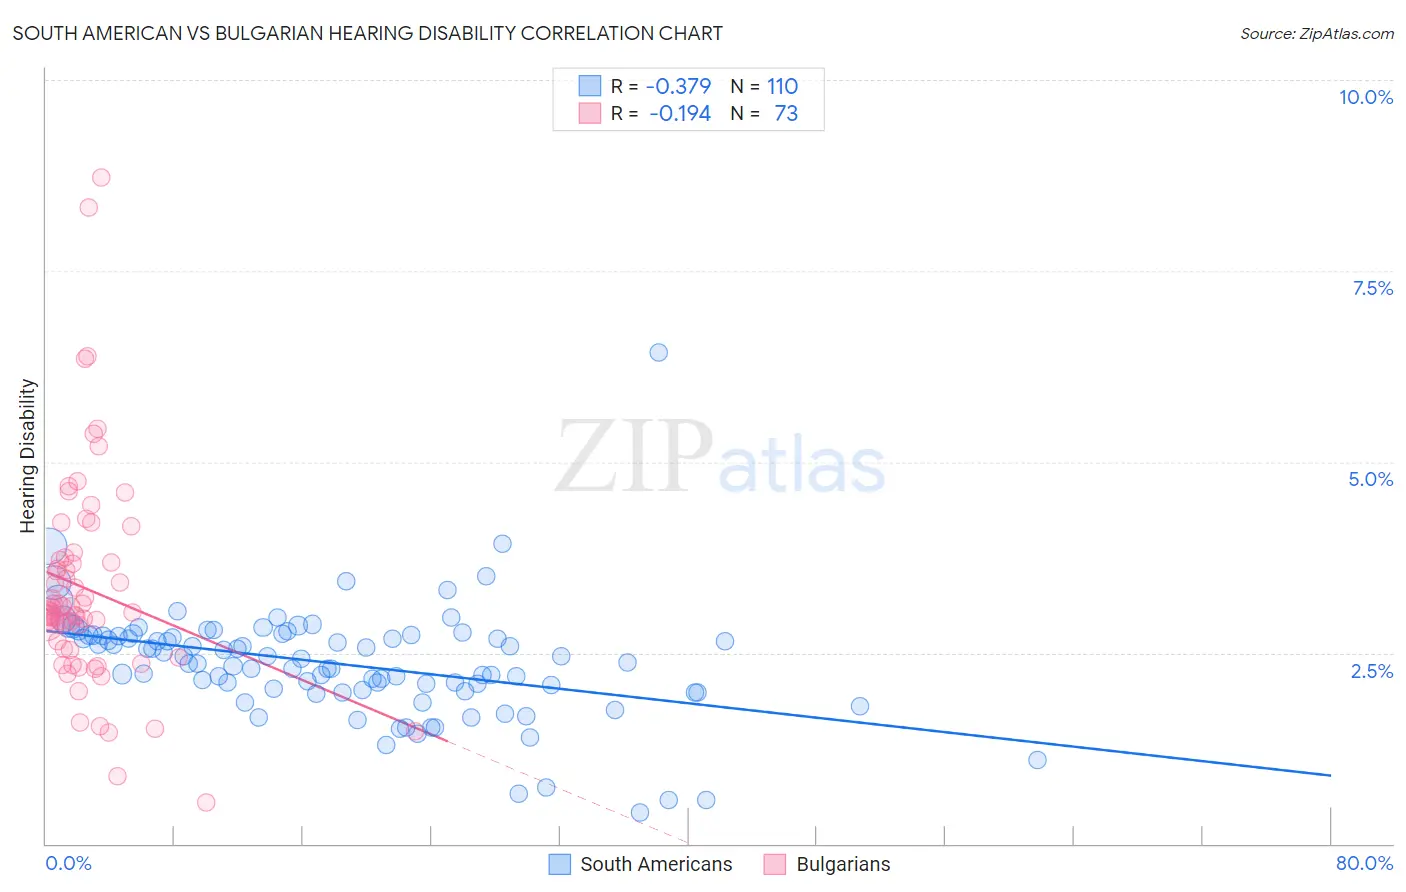
South American vs Bulgarian Hearing Disability Correlation Chart
The statistical analysis conducted on geographies consisting of 493,776,851 people shows a mild negative correlation between the proportion of South Americans and percentage of population with hearing disability in the United States with a correlation coefficient (R) of -0.379 and weighted average of 2.7%. Similarly, the statistical analysis conducted on geographies consisting of 205,610,417 people shows a poor negative correlation between the proportion of Bulgarians and percentage of population with hearing disability in the United States with a correlation coefficient (R) of -0.194 and weighted average of 3.0%, a difference of 13.0%.
Hearing Disability Correlation Summary
| Measurement | South American | Bulgarian |
| Minimum | 0.40% | 0.54% |
| Maximum | 6.4% | 8.7% |
| Range | 6.0% | 8.2% |
| Mean | 2.4% | 3.3% |
| Median | 2.4% | 3.1% |
| Interquartile 25% (IQ1) | 2.0% | 2.5% |
| Interquartile 75% (IQ3) | 2.7% | 3.7% |
| Interquartile Range (IQR) | 0.71% | 1.2% |
| Standard Deviation (Sample) | 0.75% | 1.4% |
| Standard Deviation (Population) | 0.75% | 1.4% |
Similar Demographics by Hearing Disability
Demographics Similar to South Americans by Hearing Disability
In terms of hearing disability, the demographic groups most similar to South Americans are Immigrants from Nicaragua (2.7%, a difference of 0.040%), Immigrants from Ethiopia (2.7%, a difference of 0.070%), Ethiopian (2.7%, a difference of 0.13%), Immigrants from Eastern Asia (2.7%, a difference of 0.16%), and Jamaican (2.7%, a difference of 0.23%).
| Demographics | Rating | Rank | Hearing Disability |
| Paraguayans | 99.2 /100 | #50 | Exceptional 2.7% |
| Immigrants | Hong Kong | 99.2 /100 | #51 | Exceptional 2.7% |
| Jamaicans | 99.0 /100 | #52 | Exceptional 2.7% |
| Immigrants | Eastern Asia | 99.0 /100 | #53 | Exceptional 2.7% |
| Ethiopians | 99.0 /100 | #54 | Exceptional 2.7% |
| Immigrants | Ethiopia | 99.0 /100 | #55 | Exceptional 2.7% |
| Immigrants | Nicaragua | 99.0 /100 | #56 | Exceptional 2.7% |
| South Americans | 99.0 /100 | #57 | Exceptional 2.7% |
| Immigrants | Peru | 98.6 /100 | #58 | Exceptional 2.7% |
| Immigrants | Eritrea | 98.5 /100 | #59 | Exceptional 2.7% |
| Immigrants | Egypt | 98.5 /100 | #60 | Exceptional 2.7% |
| Immigrants | Uzbekistan | 98.4 /100 | #61 | Exceptional 2.7% |
| Immigrants | Colombia | 98.4 /100 | #62 | Exceptional 2.7% |
| Indians (Asian) | 98.4 /100 | #63 | Exceptional 2.7% |
| Immigrants | Sri Lanka | 98.4 /100 | #64 | Exceptional 2.7% |
Demographics Similar to Bulgarians by Hearing Disability
In terms of hearing disability, the demographic groups most similar to Bulgarians are Immigrants from Italy (3.0%, a difference of 0.14%), Immigrants from Belgium (3.0%, a difference of 0.17%), Immigrants from Ireland (3.0%, a difference of 0.23%), Immigrants from Sweden (3.0%, a difference of 0.26%), and Immigrants from Moldova (3.0%, a difference of 0.32%).
| Demographics | Rating | Rank | Hearing Disability |
| Panamanians | 47.0 /100 | #176 | Average 3.0% |
| Immigrants | Philippines | 46.4 /100 | #177 | Average 3.0% |
| Japanese | 46.0 /100 | #178 | Average 3.0% |
| Immigrants | Moldova | 43.1 /100 | #179 | Average 3.0% |
| Immigrants | Sweden | 42.4 /100 | #180 | Average 3.0% |
| Immigrants | Belgium | 41.5 /100 | #181 | Average 3.0% |
| Immigrants | Italy | 41.1 /100 | #182 | Average 3.0% |
| Bulgarians | 39.7 /100 | #183 | Fair 3.0% |
| Immigrants | Ireland | 37.4 /100 | #184 | Fair 3.0% |
| Immigrants | Southern Europe | 35.3 /100 | #185 | Fair 3.0% |
| Immigrants | Mexico | 34.9 /100 | #186 | Fair 3.0% |
| Blacks/African Americans | 34.7 /100 | #187 | Fair 3.0% |
| Mexican American Indians | 34.7 /100 | #188 | Fair 3.0% |
| Africans | 32.9 /100 | #189 | Fair 3.0% |
| Immigrants | South Africa | 31.1 /100 | #190 | Fair 3.1% |