South American Indian vs Immigrants from Turkey Disability Age 18 to 34
COMPARE
South American Indian
Immigrants from Turkey
Disability Age 18 to 34
Disability Age 18 to 34 Comparison
South American Indians
Immigrants from Turkey
6.4%
DISABILITY AGE 18 TO 34
86.5/ 100
METRIC RATING
142nd/ 347
METRIC RANK
6.1%
DISABILITY AGE 18 TO 34
99.1/ 100
METRIC RATING
75th/ 347
METRIC RANK
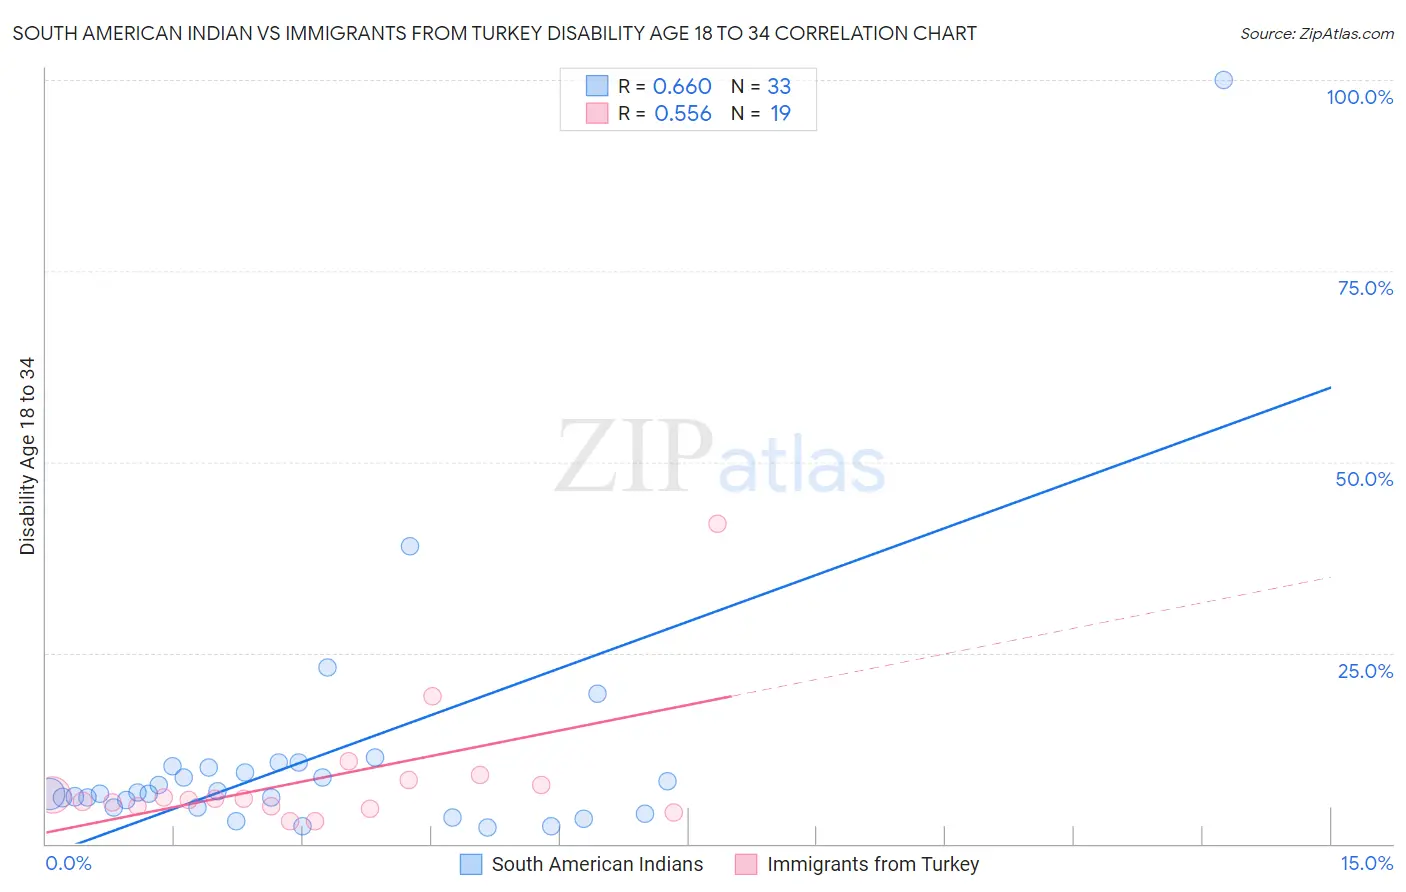
South American Indian vs Immigrants from Turkey Disability Age 18 to 34 Correlation Chart
The statistical analysis conducted on geographies consisting of 164,481,999 people shows a significant positive correlation between the proportion of South American Indians and percentage of population with a disability between the ages 18 and 35 in the United States with a correlation coefficient (R) of 0.660 and weighted average of 6.4%. Similarly, the statistical analysis conducted on geographies consisting of 222,773,671 people shows a substantial positive correlation between the proportion of Immigrants from Turkey and percentage of population with a disability between the ages 18 and 35 in the United States with a correlation coefficient (R) of 0.556 and weighted average of 6.1%, a difference of 5.3%.
Disability Age 18 to 34 Correlation Summary
| Measurement | South American Indian | Immigrants from Turkey |
| Minimum | 2.2% | 2.9% |
| Maximum | 100.0% | 42.0% |
| Range | 97.8% | 39.0% |
| Mean | 11.2% | 8.6% |
| Median | 6.5% | 5.8% |
| Interquartile 25% (IQ1) | 4.8% | 4.9% |
| Interquartile 75% (IQ3) | 10.0% | 8.4% |
| Interquartile Range (IQR) | 5.2% | 3.5% |
| Standard Deviation (Sample) | 17.4% | 8.9% |
| Standard Deviation (Population) | 17.2% | 8.6% |
Similar Demographics by Disability Age 18 to 34
Demographics Similar to South American Indians by Disability Age 18 to 34
In terms of disability age 18 to 34, the demographic groups most similar to South American Indians are Immigrants from Latvia (6.4%, a difference of 0.020%), Jamaican (6.4%, a difference of 0.030%), Immigrants from Fiji (6.4%, a difference of 0.12%), Immigrants from Belize (6.4%, a difference of 0.14%), and Immigrants from Honduras (6.4%, a difference of 0.19%).
| Demographics | Rating | Rank | Disability Age 18 to 34 |
| Palestinians | 88.5 /100 | #135 | Excellent 6.4% |
| Immigrants | Sweden | 88.5 /100 | #136 | Excellent 6.4% |
| Immigrants | Honduras | 87.7 /100 | #137 | Excellent 6.4% |
| Spanish American Indians | 87.7 /100 | #138 | Excellent 6.4% |
| Immigrants | Belize | 87.4 /100 | #139 | Excellent 6.4% |
| Immigrants | Fiji | 87.3 /100 | #140 | Excellent 6.4% |
| Jamaicans | 86.8 /100 | #141 | Excellent 6.4% |
| South American Indians | 86.5 /100 | #142 | Excellent 6.4% |
| Immigrants | Latvia | 86.4 /100 | #143 | Excellent 6.4% |
| Albanians | 85.3 /100 | #144 | Excellent 6.4% |
| Moroccans | 85.2 /100 | #145 | Excellent 6.4% |
| Belizeans | 84.9 /100 | #146 | Excellent 6.4% |
| Immigrants | South Africa | 83.7 /100 | #147 | Excellent 6.4% |
| Immigrants | Belgium | 83.5 /100 | #148 | Excellent 6.4% |
| Hondurans | 83.1 /100 | #149 | Excellent 6.4% |
Demographics Similar to Immigrants from Turkey by Disability Age 18 to 34
In terms of disability age 18 to 34, the demographic groups most similar to Immigrants from Turkey are Immigrants from Western Asia (6.1%, a difference of 0.28%), Haitian (6.0%, a difference of 0.29%), Immigrants from Lebanon (6.0%, a difference of 0.38%), Cypriot (6.0%, a difference of 0.38%), and Immigrants from Russia (6.1%, a difference of 0.38%).
| Demographics | Rating | Rank | Disability Age 18 to 34 |
| Immigrants | Poland | 99.5 /100 | #68 | Exceptional 6.0% |
| Immigrants | West Indies | 99.4 /100 | #69 | Exceptional 6.0% |
| Immigrants | Greece | 99.4 /100 | #70 | Exceptional 6.0% |
| Immigrants | Japan | 99.3 /100 | #71 | Exceptional 6.0% |
| Immigrants | Lebanon | 99.2 /100 | #72 | Exceptional 6.0% |
| Cypriots | 99.2 /100 | #73 | Exceptional 6.0% |
| Haitians | 99.2 /100 | #74 | Exceptional 6.0% |
| Immigrants | Turkey | 99.1 /100 | #75 | Exceptional 6.1% |
| Immigrants | Western Asia | 98.9 /100 | #76 | Exceptional 6.1% |
| Immigrants | Russia | 98.9 /100 | #77 | Exceptional 6.1% |
| Assyrians/Chaldeans/Syriacs | 98.9 /100 | #78 | Exceptional 6.1% |
| Afghans | 98.7 /100 | #79 | Exceptional 6.1% |
| Immigrants | Chile | 98.5 /100 | #80 | Exceptional 6.1% |
| Immigrants | Australia | 98.5 /100 | #81 | Exceptional 6.1% |
| Immigrants | Northern Africa | 98.4 /100 | #82 | Exceptional 6.1% |