Somali vs Yup'ik Vision Disability
COMPARE
Somali
Yup'ik
Vision Disability
Vision Disability Comparison
Somalis
Yup'ik
2.0%
VISION DISABILITY
99.2/ 100
METRIC RATING
57th/ 347
METRIC RANK
2.7%
VISION DISABILITY
0.0/ 100
METRIC RATING
317th/ 347
METRIC RANK
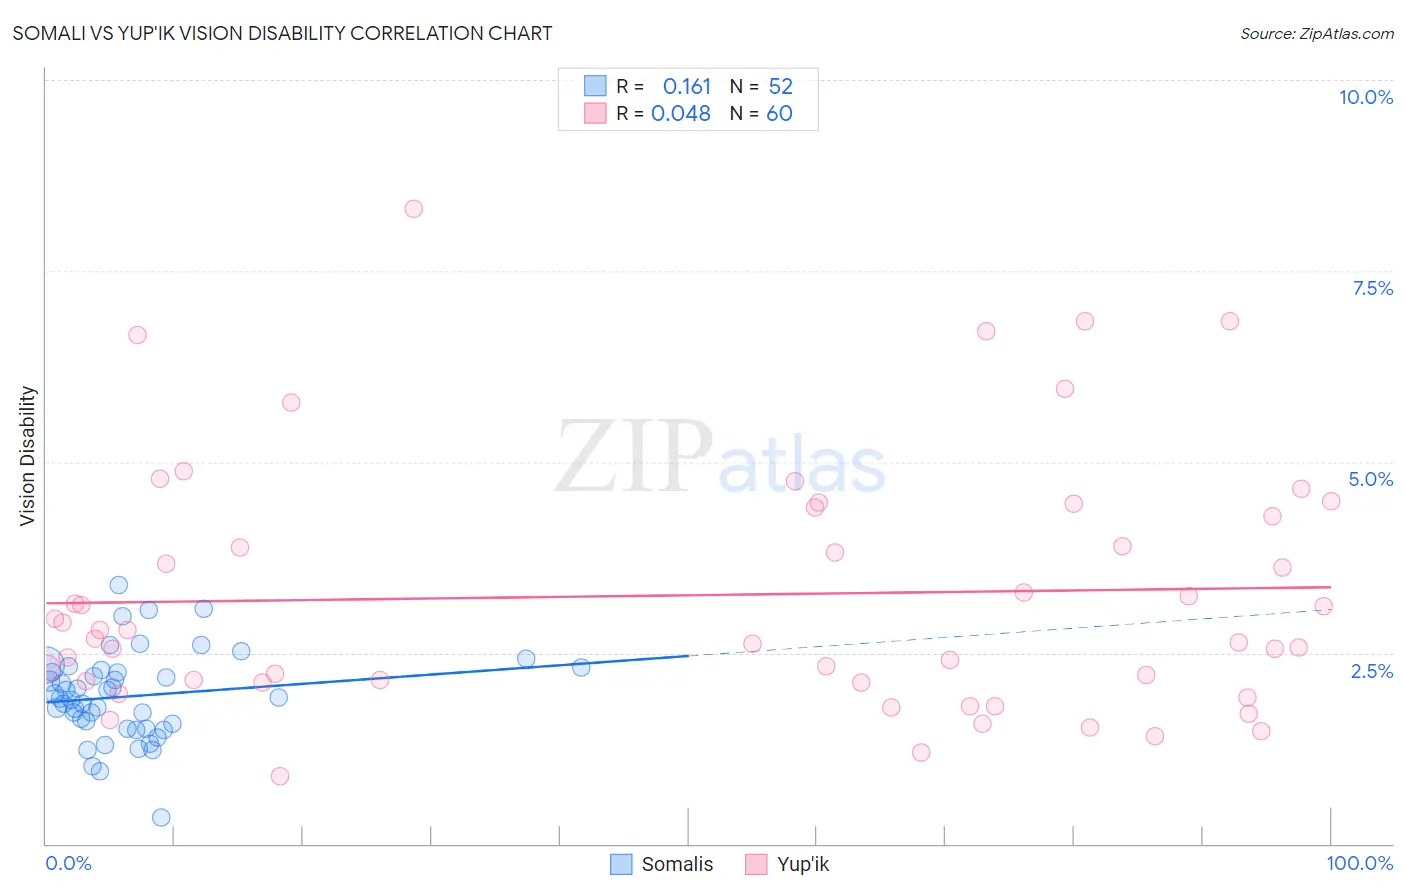
Somali vs Yup'ik Vision Disability Correlation Chart
The statistical analysis conducted on geographies consisting of 99,264,123 people shows a poor positive correlation between the proportion of Somalis and percentage of population with vision disability in the United States with a correlation coefficient (R) of 0.161 and weighted average of 2.0%. Similarly, the statistical analysis conducted on geographies consisting of 39,951,250 people shows no correlation between the proportion of Yup'ik and percentage of population with vision disability in the United States with a correlation coefficient (R) of 0.048 and weighted average of 2.7%, a difference of 34.9%.
Vision Disability Correlation Summary
| Measurement | Somali | Yup'ik |
| Minimum | 0.35% | 0.88% |
| Maximum | 3.4% | 8.3% |
| Range | 3.0% | 7.4% |
| Mean | 1.9% | 3.3% |
| Median | 1.9% | 2.7% |
| Interquartile 25% (IQ1) | 1.5% | 2.1% |
| Interquartile 75% (IQ3) | 2.3% | 4.3% |
| Interquartile Range (IQR) | 0.72% | 2.2% |
| Standard Deviation (Sample) | 0.58% | 1.6% |
| Standard Deviation (Population) | 0.57% | 1.6% |
Similar Demographics by Vision Disability
Demographics Similar to Somalis by Vision Disability
In terms of vision disability, the demographic groups most similar to Somalis are Jordanian (2.0%, a difference of 0.020%), Immigrants from Saudi Arabia (2.0%, a difference of 0.070%), Laotian (2.0%, a difference of 0.19%), Argentinean (2.0%, a difference of 0.21%), and Macedonian (2.0%, a difference of 0.24%).
| Demographics | Rating | Rank | Vision Disability |
| Afghans | 99.5 /100 | #50 | Exceptional 2.0% |
| Tongans | 99.5 /100 | #51 | Exceptional 2.0% |
| Immigrants | Serbia | 99.4 /100 | #52 | Exceptional 2.0% |
| Immigrants | Belarus | 99.3 /100 | #53 | Exceptional 2.0% |
| Macedonians | 99.3 /100 | #54 | Exceptional 2.0% |
| Laotians | 99.3 /100 | #55 | Exceptional 2.0% |
| Jordanians | 99.2 /100 | #56 | Exceptional 2.0% |
| Somalis | 99.2 /100 | #57 | Exceptional 2.0% |
| Immigrants | Saudi Arabia | 99.2 /100 | #58 | Exceptional 2.0% |
| Argentineans | 99.1 /100 | #59 | Exceptional 2.0% |
| Immigrants | Romania | 99.1 /100 | #60 | Exceptional 2.0% |
| Immigrants | Belgium | 99.1 /100 | #61 | Exceptional 2.0% |
| Immigrants | Russia | 99.1 /100 | #62 | Exceptional 2.0% |
| Armenians | 99.0 /100 | #63 | Exceptional 2.0% |
| Immigrants | Greece | 99.0 /100 | #64 | Exceptional 2.0% |
Demographics Similar to Yup'ik by Vision Disability
In terms of vision disability, the demographic groups most similar to Yup'ik are Shoshone (2.7%, a difference of 0.20%), Osage (2.7%, a difference of 0.63%), Alaska Native (2.7%, a difference of 1.1%), Inupiat (2.7%, a difference of 1.8%), and Potawatomi (2.6%, a difference of 1.9%).
| Demographics | Rating | Rank | Vision Disability |
| Blackfeet | 0.0 /100 | #310 | Tragic 2.6% |
| Dominicans | 0.0 /100 | #311 | Tragic 2.6% |
| Americans | 0.0 /100 | #312 | Tragic 2.6% |
| Potawatomi | 0.0 /100 | #313 | Tragic 2.6% |
| Inupiat | 0.0 /100 | #314 | Tragic 2.7% |
| Osage | 0.0 /100 | #315 | Tragic 2.7% |
| Shoshone | 0.0 /100 | #316 | Tragic 2.7% |
| Yup'ik | 0.0 /100 | #317 | Tragic 2.7% |
| Alaska Natives | 0.0 /100 | #318 | Tragic 2.7% |
| Tohono O'odham | 0.0 /100 | #319 | Tragic 2.8% |
| Blacks/African Americans | 0.0 /100 | #320 | Tragic 2.8% |
| Comanche | 0.0 /100 | #321 | Tragic 2.8% |
| Paiute | 0.0 /100 | #322 | Tragic 2.9% |
| Tlingit-Haida | 0.0 /100 | #323 | Tragic 2.9% |
| Hopi | 0.0 /100 | #324 | Tragic 2.9% |