Somali vs Yaqui Disability Age 35 to 64
COMPARE
Somali
Yaqui
Disability Age 35 to 64
Disability Age 35 to 64 Comparison
Somalis
Yaqui
12.9%
DISABILITY AGE 35 TO 64
0.1/ 100
METRIC RATING
276th/ 347
METRIC RANK
13.5%
DISABILITY AGE 35 TO 64
0.0/ 100
METRIC RATING
294th/ 347
METRIC RANK
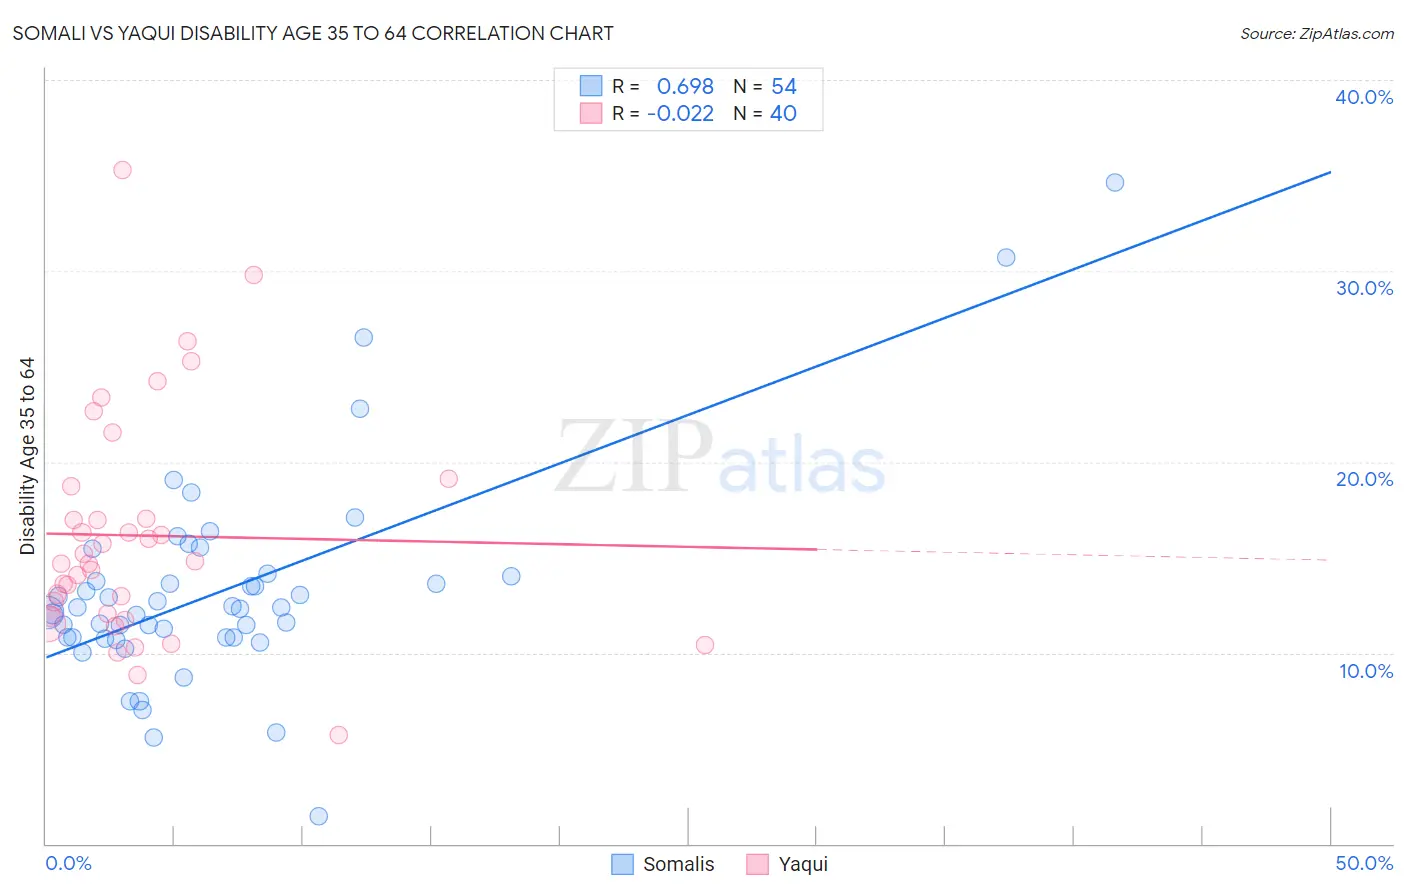
Somali vs Yaqui Disability Age 35 to 64 Correlation Chart
The statistical analysis conducted on geographies consisting of 99,279,569 people shows a significant positive correlation between the proportion of Somalis and percentage of population with a disability between the ages 34 and 64 in the United States with a correlation coefficient (R) of 0.698 and weighted average of 12.9%. Similarly, the statistical analysis conducted on geographies consisting of 107,720,635 people shows no correlation between the proportion of Yaqui and percentage of population with a disability between the ages 34 and 64 in the United States with a correlation coefficient (R) of -0.022 and weighted average of 13.5%, a difference of 4.5%.
Disability Age 35 to 64 Correlation Summary
| Measurement | Somali | Yaqui |
| Minimum | 1.4% | 5.7% |
| Maximum | 34.6% | 35.3% |
| Range | 33.2% | 29.6% |
| Mean | 13.2% | 16.1% |
| Median | 12.3% | 14.8% |
| Interquartile 25% (IQ1) | 10.8% | 12.0% |
| Interquartile 75% (IQ3) | 14.0% | 17.9% |
| Interquartile Range (IQR) | 3.2% | 5.9% |
| Standard Deviation (Sample) | 5.5% | 6.0% |
| Standard Deviation (Population) | 5.5% | 5.9% |
Demographics Similar to Somalis and Yaqui by Disability Age 35 to 64
In terms of disability age 35 to 64, the demographic groups most similar to Somalis are Dominican (12.9%, a difference of 0.12%), Immigrants from Dominican Republic (12.9%, a difference of 0.20%), French Canadian (12.9%, a difference of 0.23%), Immigrants from Micronesia (12.9%, a difference of 0.25%), and Liberian (12.9%, a difference of 0.42%). Similarly, the demographic groups most similar to Yaqui are Ute (13.4%, a difference of 0.58%), Yakama (13.6%, a difference of 0.68%), Puget Sound Salish (13.3%, a difference of 1.1%), Immigrants from Congo (13.3%, a difference of 1.1%), and Immigrants from Liberia (13.2%, a difference of 1.6%).
| Demographics | Rating | Rank | Disability Age 35 to 64 |
| Dominicans | 0.1 /100 | #275 | Tragic 12.9% |
| Somalis | 0.1 /100 | #276 | Tragic 12.9% |
| Immigrants | Dominican Republic | 0.1 /100 | #277 | Tragic 12.9% |
| French Canadians | 0.1 /100 | #278 | Tragic 12.9% |
| Immigrants | Micronesia | 0.1 /100 | #279 | Tragic 12.9% |
| Liberians | 0.1 /100 | #280 | Tragic 12.9% |
| Scotch-Irish | 0.1 /100 | #281 | Tragic 13.0% |
| Immigrants | Laos | 0.1 /100 | #282 | Tragic 13.0% |
| Central American Indians | 0.0 /100 | #283 | Tragic 13.0% |
| Immigrants | Nonimmigrants | 0.0 /100 | #284 | Tragic 13.0% |
| Immigrants | Somalia | 0.0 /100 | #285 | Tragic 13.1% |
| Hmong | 0.0 /100 | #286 | Tragic 13.1% |
| Tlingit-Haida | 0.0 /100 | #287 | Tragic 13.2% |
| Fijians | 0.0 /100 | #288 | Tragic 13.2% |
| Indonesians | 0.0 /100 | #289 | Tragic 13.2% |
| Immigrants | Liberia | 0.0 /100 | #290 | Tragic 13.2% |
| Immigrants | Congo | 0.0 /100 | #291 | Tragic 13.3% |
| Puget Sound Salish | 0.0 /100 | #292 | Tragic 13.3% |
| Ute | 0.0 /100 | #293 | Tragic 13.4% |
| Yaqui | 0.0 /100 | #294 | Tragic 13.5% |
| Yakama | 0.0 /100 | #295 | Tragic 13.6% |