Sioux vs Immigrants from England Cognitive Disability

COMPARE

Sioux
Race
Ancestry
AfghanAfricanAlaska NativeAlaskan AthabascanAlbanianAleutAlsatianAmericanApacheArabArapahoArgentineanArmenianAssyrian/Chaldean/SyriacAustralianAustrianBahamianBangladeshiBarbadianBasqueBelgianBelizeanBermudanBhutaneseBlackfeetBolivianBrazilianBritishBritish West IndianBulgarianBurmeseCajunCambodianCanadianCape VerdeanCarpatho RusynCelticCentral AmericanCentral American IndianCherokeeCheyenneChickasawChileanChineseChippewaChoctawColombianColvilleComancheCosta RicanCreeCreekCroatianCrowCubanCypriotCzechCzechoslovakianDanishDelawareDominicanDutchDutch West IndianEastern EuropeanEcuadorianEgyptianEnglishEstonianEthiopianEuropeanFijianFilipinoFinnishFrenchFrench American IndianFrench CanadianGermanGerman RussianGhanaianGreekGuamanian/ChamorroGuatemalanGuyaneseHaitianHmongHonduranHopiHoumaHungarianIcelanderIndian (Asian)IndonesianInupiatIranianIraqiIrishIroquoisIsraeliItalianJamaicanJapaneseJordanianKenyanKiowaKoreanLaotianLatvianLebaneseLiberianLithuanianLumbeeLuxembourgerMacedonianMalaysianMalteseMarshalleseMenomineeMexicanMexican American IndianMongolianMoroccanNative HawaiianNavajoNepaleseNew ZealanderNicaraguanNigerianNorthern EuropeanNorwegianOkinawanOsageOttawaPaiutePakistaniPalestinianPanamanianParaguayanPennsylvania GermanPeruvianPimaPolishPortuguesePotawatomiPuebloPuerto RicanPuget Sound SalishRomanianRussianSalvadoranSamoanScandinavianScotch-IrishScottishSeminoleSenegaleseSerbianShoshoneSierra LeoneanSiouxSlavicSlovakSloveneSomaliSouth AfricanSouth AmericanSouth American IndianSoviet UnionSpaniardSpanishSpanish AmericanSpanish American IndianSri LankanSubsaharan AfricanSudaneseSwedishSwissSyrianTaiwaneseThaiTlingit-HaidaTohono O'OdhamTonganTrinidadian and TobagonianTsimshianTurkishU.S. Virgin IslanderUgandanUkrainianUruguayanUteVenezuelanVietnameseWelshWest IndianYakamaYaquiYugoslavianYumanYup'ikZimbabwean
Immigration
NonimmigrantsImmigrantsAfghanistanAfricaAlbaniaArgentinaArmeniaAsiaAustraliaAustriaBahamasBangladeshBarbadosBelarusBelgiumBelizeBoliviaBosnia and HerzegovinaBrazilBulgariaBurma/MyanmarCabo VerdeCambodiaCameroonCanadaCaribbeanCentral AmericaChileChinaColombiaCongoCosta RicaCroatiaCubaCzechoslovakiaDenmarkDominicaDominican RepublicEastern AfricaEastern AsiaEastern EuropeEcuadorEgyptEl SalvadorEritreaEthiopiaEuropeFijiFranceGermanyGhanaGreeceGrenadaGuatemalaGuyanaHaitiHondurasHong KongHungaryIndiaIndonesiaIranIraqIrelandIsraelItalyJamaicaJapanJordanKazakhstanKenyaKoreaKuwaitLaosLatin AmericaLatviaLebanonLiberiaLithuaniaMalaysiaMexicoMicronesiaMiddle AfricaMoldovaMoroccoNepalNetherlandsNicaraguaNigeriaNorth AmericaNorth MacedoniaNorthern AfricaNorthern EuropeNorwayOceaniaPakistanPanamaPeruPhilippinesPolandPortugalRomaniaRussiaSaudi ArabiaScotlandSenegalSerbiaSierra LeoneSingaporeSomaliaSouth AfricaSouth AmericaSouth Central AsiaSouth Eastern AsiaSouthern EuropeSpainSri LankaSt. Vincent and the GrenadinesSudanSwedenSwitzerlandSyriaTaiwanThailandTrinidad and TobagoTurkeyUgandaUkraineUruguayUzbekistanVenezuelaVietnamWest IndiesWestern AfricaWestern AsiaWestern EuropeYemenZaireZimbabweAzores
Immigrants from England
Race
Ancestry
AfghanAfricanAlaska NativeAlaskan AthabascanAlbanianAleutAlsatianAmericanApacheArabArapahoArgentineanArmenianAssyrian/Chaldean/SyriacAustralianAustrianBahamianBangladeshiBarbadianBasqueBelgianBelizeanBermudanBhutaneseBlackfeetBolivianBrazilianBritishBritish West IndianBulgarianBurmeseCajunCambodianCanadianCape VerdeanCarpatho RusynCelticCentral AmericanCentral American IndianCherokeeCheyenneChickasawChileanChineseChippewaChoctawColombianColvilleComancheCosta RicanCreeCreekCroatianCrowCubanCypriotCzechCzechoslovakianDanishDelawareDominicanDutchDutch West IndianEastern EuropeanEcuadorianEgyptianEnglishEstonianEthiopianEuropeanFijianFilipinoFinnishFrenchFrench American IndianFrench CanadianGermanGerman RussianGhanaianGreekGuamanian/ChamorroGuatemalanGuyaneseHaitianHmongHonduranHopiHoumaHungarianIcelanderIndian (Asian)IndonesianInupiatIranianIraqiIrishIroquoisIsraeliItalianJamaicanJapaneseJordanianKenyanKiowaKoreanLaotianLatvianLebaneseLiberianLithuanianLumbeeLuxembourgerMacedonianMalaysianMalteseMarshalleseMenomineeMexicanMexican American IndianMongolianMoroccanNative HawaiianNavajoNepaleseNew ZealanderNicaraguanNigerianNorthern EuropeanNorwegianOkinawanOsageOttawaPaiutePakistaniPalestinianPanamanianParaguayanPennsylvania GermanPeruvianPimaPolishPortuguesePotawatomiPuebloPuerto RicanPuget Sound SalishRomanianRussianSalvadoranSamoanScandinavianScotch-IrishScottishSeminoleSenegaleseSerbianShoshoneSierra LeoneanSlavicSlovakSloveneSomaliSouth AfricanSouth AmericanSouth American IndianSoviet UnionSpaniardSpanishSpanish AmericanSpanish American IndianSri LankanSubsaharan AfricanSudaneseSwedishSwissSyrianTaiwaneseThaiTlingit-HaidaTohono O'OdhamTonganTrinidadian and TobagonianTsimshianTurkishU.S. Virgin IslanderUgandanUkrainianUruguayanUteVenezuelanVietnameseWelshWest IndianYakamaYaquiYugoslavianYumanYup'ikZimbabwean
Immigration
NonimmigrantsImmigrantsAfghanistanAfricaAlbaniaArgentinaArmeniaAsiaAustraliaAustriaBahamasBangladeshBarbadosBelarusBelgiumBelizeBoliviaBosnia and HerzegovinaBrazilBulgariaBurma/MyanmarCabo VerdeCambodiaCameroonCanadaCaribbeanCentral AmericaChileChinaColombiaCongoCosta RicaCroatiaCubaCzechoslovakiaDenmarkDominicaDominican RepublicEastern AfricaEastern AsiaEastern EuropeEcuadorEgyptEl SalvadorEnglandEritreaEthiopiaEuropeFijiFranceGermanyGhanaGreeceGrenadaGuatemalaGuyanaHaitiHondurasHong KongHungaryIndiaIndonesiaIranIraqIrelandIsraelItalyJamaicaJapanJordanKazakhstanKenyaKoreaKuwaitLaosLatin AmericaLatviaLebanonLiberiaLithuaniaMalaysiaMexicoMicronesiaMiddle AfricaMoldovaMoroccoNepalNetherlandsNicaraguaNigeriaNorth AmericaNorth MacedoniaNorthern AfricaNorthern EuropeNorwayOceaniaPakistanPanamaPeruPhilippinesPolandPortugalRomaniaRussiaSaudi ArabiaScotlandSenegalSerbiaSierra LeoneSingaporeSomaliaSouth AfricaSouth AmericaSouth Central AsiaSouth Eastern AsiaSouthern EuropeSpainSri LankaSt. Vincent and the GrenadinesSudanSwedenSwitzerlandSyriaTaiwanThailandTrinidad and TobagoTurkeyUgandaUkraineUruguayUzbekistanVenezuelaVietnamWest IndiesWestern AfricaWestern AsiaWestern EuropeYemenZaireZimbabweAzores
Cognitive Disability
Income
Poverty
Unemployment
Labor Participation
Family Structure
Vehicle Availability
Education Level
Disability

Cognitive Disability Comparison

Sioux

Immigrants from England

Average
Exceptional
17.3%
COGNITIVE DISABILITY
48.6/ 100
METRIC RATING
179th/ 347
METRIC RANK
16.6%
COGNITIVE DISABILITY
99.6/ 100
METRIC RATING
61st/ 347
METRIC RANK

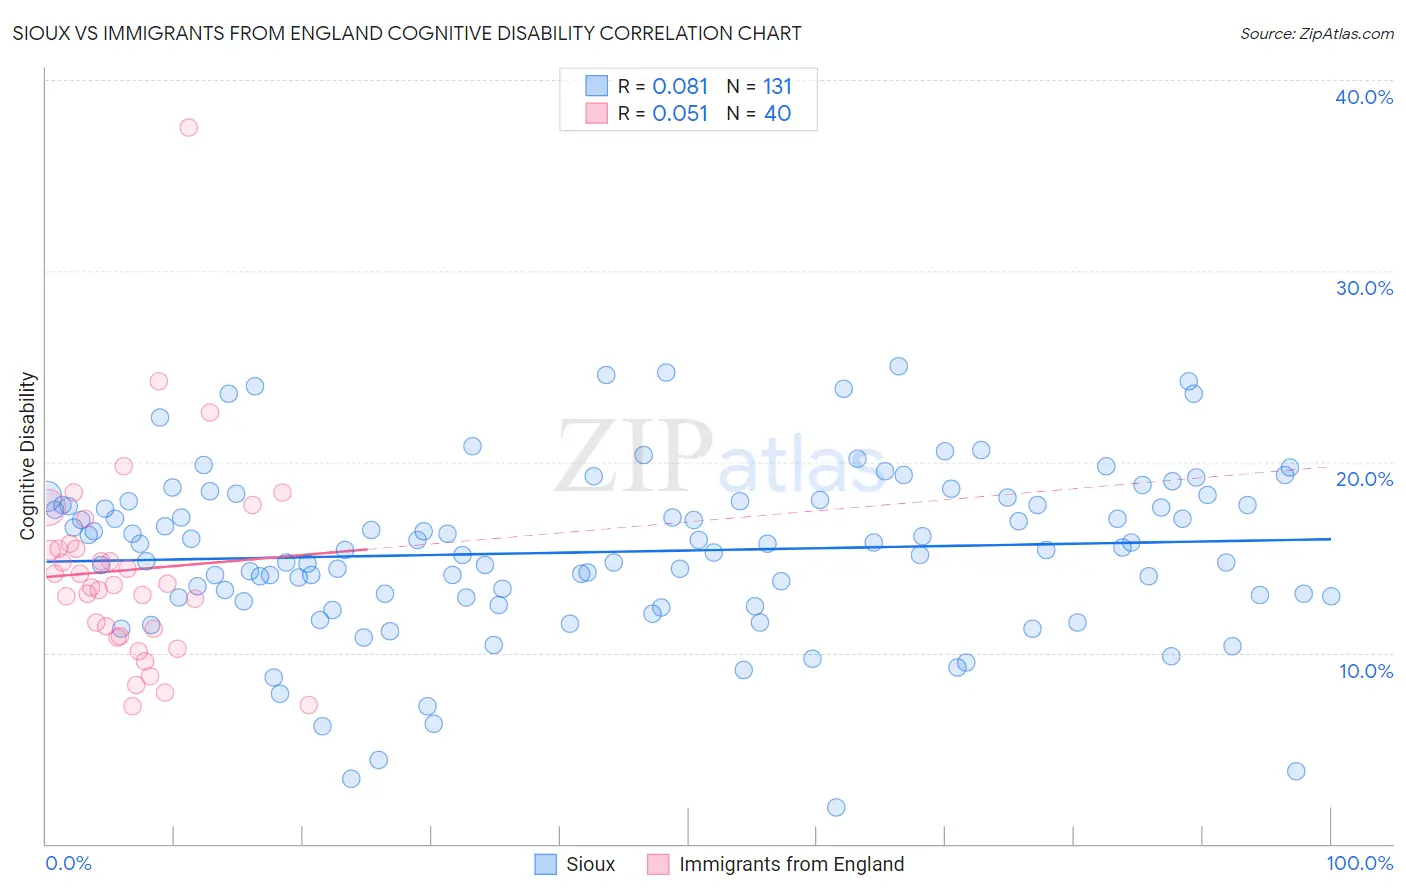
Sioux vs Immigrants from England Cognitive Disability Correlation Chart

The statistical analysis conducted on geographies consisting of 234,153,820 people shows a slight positive correlation between the proportion of Sioux and percentage of population with cognitive disability in the United States with a correlation coefficient (R) of 0.081 and weighted average of 17.3%. Similarly, the statistical analysis conducted on geographies consisting of 391,893,945 people shows a slight positive correlation between the proportion of Immigrants from England and percentage of population with cognitive disability in the United States with a correlation coefficient (R) of 0.051 and weighted average of 16.6%, a difference of 4.2%.
Sioux vs Immigrants from England Cognitive Disability

Cognitive Disability Correlation Summary

MeasurementSiouxImmigrants from England
Minimum1.9%7.2%
Maximum25.0%37.5%
Range23.1%30.3%
Mean15.3%14.3%
Median15.5%13.6%
Interquartile 25% (IQ1)12.9%11.1%
Interquartile 75% (IQ3)17.9%15.6%
Interquartile Range (IQR)5.0%4.5%
Standard Deviation (Sample)4.4%5.4%
Standard Deviation (Population)4.4%5.3%

Similar Demographics by Cognitive Disability

Demographics Similar to Sioux by Cognitive Disability

In terms of cognitive disability, the demographic groups most similar to Sioux are Ute (17.3%, a difference of 0.010%), Spanish (17.3%, a difference of 0.010%), Shoshone (17.3%, a difference of 0.020%), Tsimshian (17.3%, a difference of 0.030%), and Laotian (17.3%, a difference of 0.040%).
DemographicsRating | RankCognitive Disability
Immigrants | Turkey
56.7
/100
|
#172
Average
17.2%
Immigrants | Northern Africa
50.2
/100
|
#173
Average
17.3%
Laotians
50.0
/100
|
#174
Average
17.3%
Tsimshian
49.8
/100
|
#175
Average
17.3%
Shoshone
49.2
/100
|
#176
Average
17.3%
Ute
49.1
/100
|
#177
Average
17.3%
Spanish
48.9
/100
|
#178
Average
17.3%
Sioux
48.6
/100
|
#179
Average
17.3%
Pakistanis
43.9
/100
|
#180
Average
17.3%
Immigrants | Guyana
42.9
/100
|
#181
Average
17.3%
Arabs
42.8
/100
|
#182
Average
17.3%
Spaniards
40.3
/100
|
#183
Average
17.3%
Crow
39.1
/100
|
#184
Fair
17.3%
Afghans
38.2
/100
|
#185
Fair
17.3%
Cambodians
35.9
/100
|
#186
Fair
17.3%

Demographics Similar to Immigrants from England by Cognitive Disability

In terms of cognitive disability, the demographic groups most similar to Immigrants from England are Czechoslovakian (16.6%, a difference of 0.030%), Argentinean (16.6%, a difference of 0.050%), Romanian (16.6%, a difference of 0.060%), Pennsylvania German (16.6%, a difference of 0.070%), and Immigrants from Peru (16.6%, a difference of 0.070%).
DemographicsRating | RankCognitive Disability
Immigrants | Iran
99.8
/100
|
#54
Exceptional
16.5%
Immigrants | Venezuela
99.7
/100
|
#55
Exceptional
16.5%
Austrians
99.7
/100
|
#56
Exceptional
16.6%
Bhutanese
99.7
/100
|
#57
Exceptional
16.6%
Pennsylvania Germans
99.7
/100
|
#58
Exceptional
16.6%
Immigrants | Peru
99.7
/100
|
#59
Exceptional
16.6%
Romanians
99.7
/100
|
#60
Exceptional
16.6%
Immigrants | England
99.6
/100
|
#61
Exceptional
16.6%
Czechoslovakians
99.6
/100
|
#62
Exceptional
16.6%
Argentineans
99.6
/100
|
#63
Exceptional
16.6%
Venezuelans
99.6
/100
|
#64
Exceptional
16.6%
Colombians
99.6
/100
|
#65
Exceptional
16.6%
Immigrants | Ukraine
99.5
/100
|
#66
Exceptional
16.6%
Latvians
99.5
/100
|
#67
Exceptional
16.6%
Ukrainians
99.4
/100
|
#68
Exceptional
16.6%