Shoshone vs Immigrants from Middle Africa Hearing Disability

COMPARE

Shoshone
Race
Ancestry
AfghanAfricanAlaska NativeAlaskan AthabascanAlbanianAleutAlsatianAmericanApacheArabArapahoArgentineanArmenianAssyrian/Chaldean/SyriacAustralianAustrianBahamianBangladeshiBarbadianBasqueBelgianBelizeanBermudanBhutaneseBlackfeetBolivianBrazilianBritishBritish West IndianBulgarianBurmeseCajunCambodianCanadianCape VerdeanCarpatho RusynCelticCentral AmericanCentral American IndianCherokeeCheyenneChickasawChileanChineseChippewaChoctawColombianColvilleComancheCosta RicanCreeCreekCroatianCrowCubanCypriotCzechCzechoslovakianDanishDelawareDominicanDutchDutch West IndianEastern EuropeanEcuadorianEgyptianEnglishEstonianEthiopianEuropeanFijianFilipinoFinnishFrenchFrench American IndianFrench CanadianGermanGerman RussianGhanaianGreekGuamanian/ChamorroGuatemalanGuyaneseHaitianHmongHonduranHopiHoumaHungarianIcelanderIndian (Asian)IndonesianInupiatIranianIraqiIrishIroquoisIsraeliItalianJamaicanJapaneseJordanianKenyanKiowaKoreanLaotianLatvianLebaneseLiberianLithuanianLumbeeLuxembourgerMacedonianMalaysianMalteseMarshalleseMenomineeMexicanMexican American IndianMongolianMoroccanNative HawaiianNavajoNepaleseNew ZealanderNicaraguanNigerianNorthern EuropeanNorwegianOkinawanOsageOttawaPaiutePakistaniPalestinianPanamanianParaguayanPennsylvania GermanPeruvianPimaPolishPortuguesePotawatomiPuebloPuerto RicanPuget Sound SalishRomanianRussianSalvadoranSamoanScandinavianScotch-IrishScottishSeminoleSenegaleseSerbianShoshoneSierra LeoneanSiouxSlavicSlovakSloveneSomaliSouth AfricanSouth AmericanSouth American IndianSoviet UnionSpaniardSpanishSpanish AmericanSpanish American IndianSri LankanSubsaharan AfricanSudaneseSwedishSwissSyrianTaiwaneseThaiTlingit-HaidaTohono O'OdhamTonganTrinidadian and TobagonianTsimshianTurkishU.S. Virgin IslanderUgandanUkrainianUruguayanUteVenezuelanVietnameseWelshWest IndianYakamaYaquiYugoslavianYumanYup'ikZimbabwean
Immigration
NonimmigrantsImmigrantsAfghanistanAfricaAlbaniaArgentinaArmeniaAsiaAustraliaAustriaBahamasBangladeshBarbadosBelarusBelgiumBelizeBoliviaBosnia and HerzegovinaBrazilBulgariaBurma/MyanmarCabo VerdeCambodiaCameroonCanadaCaribbeanCentral AmericaChileChinaColombiaCongoCosta RicaCroatiaCubaCzechoslovakiaDenmarkDominicaDominican RepublicEastern AfricaEastern AsiaEastern EuropeEcuadorEgyptEl SalvadorEnglandEritreaEthiopiaEuropeFijiFranceGermanyGhanaGreeceGrenadaGuatemalaGuyanaHaitiHondurasHong KongHungaryIndiaIndonesiaIranIraqIrelandIsraelItalyJamaicaJapanJordanKazakhstanKenyaKoreaKuwaitLaosLatin AmericaLatviaLebanonLiberiaLithuaniaMalaysiaMexicoMicronesiaMoldovaMoroccoNepalNetherlandsNicaraguaNigeriaNorth AmericaNorth MacedoniaNorthern AfricaNorthern EuropeNorwayOceaniaPakistanPanamaPeruPhilippinesPolandPortugalRomaniaRussiaSaudi ArabiaScotlandSenegalSerbiaSierra LeoneSingaporeSomaliaSouth AfricaSouth AmericaSouth Central AsiaSouth Eastern AsiaSouthern EuropeSpainSri LankaSt. Vincent and the GrenadinesSudanSwedenSwitzerlandSyriaTaiwanThailandTrinidad and TobagoTurkeyUgandaUkraineUruguayUzbekistanVenezuelaVietnamWest IndiesWestern AfricaWestern AsiaWestern EuropeYemenZaireZimbabweAzores
Immigrants from Middle Africa
Race
Ancestry
AfghanAfricanAlaska NativeAlaskan AthabascanAlbanianAleutAlsatianAmericanApacheArabArapahoArgentineanArmenianAssyrian/Chaldean/SyriacAustralianAustrianBahamianBangladeshiBarbadianBasqueBelgianBelizeanBermudanBhutaneseBlackfeetBolivianBrazilianBritishBritish West IndianBulgarianBurmeseCajunCambodianCanadianCape VerdeanCarpatho RusynCelticCentral AmericanCentral American IndianCherokeeCheyenneChickasawChileanChineseChippewaChoctawColombianColvilleComancheCosta RicanCreeCreekCroatianCrowCubanCypriotCzechCzechoslovakianDanishDelawareDominicanDutchDutch West IndianEastern EuropeanEcuadorianEgyptianEnglishEstonianEthiopianEuropeanFijianFilipinoFinnishFrenchFrench American IndianFrench CanadianGermanGerman RussianGhanaianGreekGuamanian/ChamorroGuatemalanGuyaneseHaitianHmongHonduranHopiHoumaHungarianIcelanderIndian (Asian)IndonesianInupiatIranianIraqiIrishIroquoisIsraeliItalianJamaicanJapaneseJordanianKenyanKiowaKoreanLaotianLatvianLebaneseLiberianLithuanianLumbeeLuxembourgerMacedonianMalaysianMalteseMarshalleseMenomineeMexicanMexican American IndianMongolianMoroccanNative HawaiianNavajoNepaleseNew ZealanderNicaraguanNigerianNorthern EuropeanNorwegianOkinawanOsageOttawaPaiutePakistaniPalestinianPanamanianParaguayanPennsylvania GermanPeruvianPimaPolishPortuguesePotawatomiPuebloPuerto RicanPuget Sound SalishRomanianRussianSalvadoranSamoanScandinavianScotch-IrishScottishSeminoleSenegaleseSerbianSierra LeoneanSiouxSlavicSlovakSloveneSomaliSouth AfricanSouth AmericanSouth American IndianSoviet UnionSpaniardSpanishSpanish AmericanSpanish American IndianSri LankanSubsaharan AfricanSudaneseSwedishSwissSyrianTaiwaneseThaiTlingit-HaidaTohono O'OdhamTonganTrinidadian and TobagonianTsimshianTurkishU.S. Virgin IslanderUgandanUkrainianUruguayanUteVenezuelanVietnameseWelshWest IndianYakamaYaquiYugoslavianYumanYup'ikZimbabwean
Immigration
NonimmigrantsImmigrantsAfghanistanAfricaAlbaniaArgentinaArmeniaAsiaAustraliaAustriaBahamasBangladeshBarbadosBelarusBelgiumBelizeBoliviaBosnia and HerzegovinaBrazilBulgariaBurma/MyanmarCabo VerdeCambodiaCameroonCanadaCaribbeanCentral AmericaChileChinaColombiaCongoCosta RicaCroatiaCubaCzechoslovakiaDenmarkDominicaDominican RepublicEastern AfricaEastern AsiaEastern EuropeEcuadorEgyptEl SalvadorEnglandEritreaEthiopiaEuropeFijiFranceGermanyGhanaGreeceGrenadaGuatemalaGuyanaHaitiHondurasHong KongHungaryIndiaIndonesiaIranIraqIrelandIsraelItalyJamaicaJapanJordanKazakhstanKenyaKoreaKuwaitLaosLatin AmericaLatviaLebanonLiberiaLithuaniaMalaysiaMexicoMicronesiaMiddle AfricaMoldovaMoroccoNepalNetherlandsNicaraguaNigeriaNorth AmericaNorth MacedoniaNorthern AfricaNorthern EuropeNorwayOceaniaPakistanPanamaPeruPhilippinesPolandPortugalRomaniaRussiaSaudi ArabiaScotlandSenegalSerbiaSierra LeoneSingaporeSomaliaSouth AfricaSouth AmericaSouth Central AsiaSouth Eastern AsiaSouthern EuropeSpainSri LankaSt. Vincent and the GrenadinesSudanSwedenSwitzerlandSyriaTaiwanThailandTrinidad and TobagoTurkeyUgandaUkraineUruguayUzbekistanVenezuelaVietnamWest IndiesWestern AfricaWestern AsiaWestern EuropeYemenZaireZimbabweAzores
Hearing Disability
Income
Poverty
Unemployment
Labor Participation
Family Structure
Vehicle Availability
Education Level
Disability

Hearing Disability Comparison

Shoshone

Immigrants from Middle Africa

Tragic
Exceptional
4.0%
HEARING DISABILITY
0.0/ 100
METRIC RATING
320th/ 347
METRIC RANK
2.8%
HEARING DISABILITY
96.5/ 100
METRIC RATING
91st/ 347
METRIC RANK

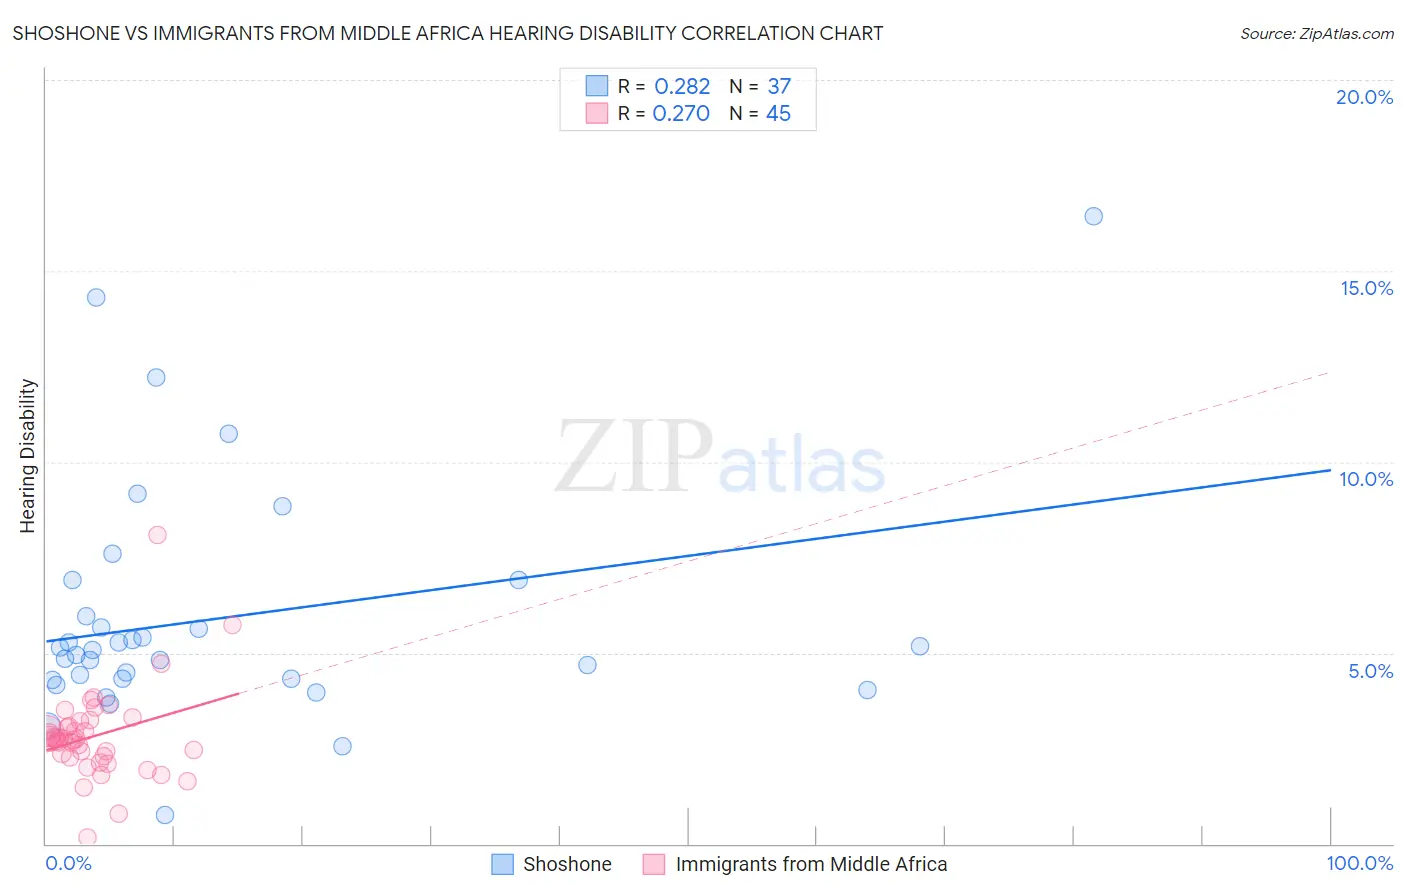
Shoshone vs Immigrants from Middle Africa Hearing Disability Correlation Chart

The statistical analysis conducted on geographies consisting of 66,619,523 people shows a weak positive correlation between the proportion of Shoshone and percentage of population with hearing disability in the United States with a correlation coefficient (R) of 0.282 and weighted average of 4.0%. Similarly, the statistical analysis conducted on geographies consisting of 202,695,899 people shows a weak positive correlation between the proportion of Immigrants from Middle Africa and percentage of population with hearing disability in the United States with a correlation coefficient (R) of 0.270 and weighted average of 2.8%, a difference of 45.8%.
Shoshone vs Immigrants from Middle Africa Hearing Disability

Hearing Disability Correlation Summary

MeasurementShoshoneImmigrants from Middle Africa
Minimum0.77%0.16%
Maximum16.4%8.1%
Range15.7%7.9%
Mean5.9%2.8%
Median5.1%2.7%
Interquartile 25% (IQ1)4.3%2.3%
Interquartile 75% (IQ3)6.4%3.1%
Interquartile Range (IQR)2.1%0.87%
Standard Deviation (Sample)3.1%1.2%
Standard Deviation (Population)3.1%1.2%

Similar Demographics by Hearing Disability

Demographics Similar to Shoshone by Hearing Disability

In terms of hearing disability, the demographic groups most similar to Shoshone are Chippewa (4.0%, a difference of 0.81%), Paiute (4.1%, a difference of 1.2%), Cheyenne (4.0%, a difference of 1.5%), Seminole (4.1%, a difference of 1.5%), and Comanche (4.0%, a difference of 1.6%).
DemographicsRating | RankHearing Disability
Hopi
0.0
/100
|
#313
Tragic
3.9%
Yakama
0.0
/100
|
#314
Tragic
3.9%
Puget Sound Salish
0.0
/100
|
#315
Tragic
3.9%
Spanish Americans
0.0
/100
|
#316
Tragic
4.0%
Comanche
0.0
/100
|
#317
Tragic
4.0%
Cheyenne
0.0
/100
|
#318
Tragic
4.0%
Chippewa
0.0
/100
|
#319
Tragic
4.0%
Shoshone
0.0
/100
|
#320
Tragic
4.0%
Paiute
0.0
/100
|
#321
Tragic
4.1%
Seminole
0.0
/100
|
#322
Tragic
4.1%
Apache
0.0
/100
|
#323
Tragic
4.1%
Osage
0.0
/100
|
#324
Tragic
4.1%
Lumbee
0.0
/100
|
#325
Tragic
4.1%
Potawatomi
0.0
/100
|
#326
Tragic
4.1%
Arapaho
0.0
/100
|
#327
Tragic
4.1%

Demographics Similar to Immigrants from Middle Africa by Hearing Disability

In terms of hearing disability, the demographic groups most similar to Immigrants from Middle Africa are Iranian (2.8%, a difference of 0.030%), Immigrants from Morocco (2.8%, a difference of 0.080%), Belizean (2.8%, a difference of 0.11%), Immigrants from Turkey (2.8%, a difference of 0.13%), and Immigrants from Kuwait (2.8%, a difference of 0.15%).
DemographicsRating | RankHearing Disability
Immigrants | Argentina
97.0
/100
|
#84
Exceptional
2.8%
Immigrants | Northern Africa
96.9
/100
|
#85
Exceptional
2.8%
Immigrants | Iran
96.8
/100
|
#86
Exceptional
2.8%
Somalis
96.7
/100
|
#87
Exceptional
2.8%
Immigrants | Turkey
96.7
/100
|
#88
Exceptional
2.8%
Belizeans
96.6
/100
|
#89
Exceptional
2.8%
Immigrants | Morocco
96.6
/100
|
#90
Exceptional
2.8%
Immigrants | Middle Africa
96.5
/100
|
#91
Exceptional
2.8%
Iranians
96.4
/100
|
#92
Exceptional
2.8%
Immigrants | Kuwait
96.3
/100
|
#93
Exceptional
2.8%
Uruguayans
95.9
/100
|
#94
Exceptional
2.8%
Israelis
95.9
/100
|
#95
Exceptional
2.8%
Immigrants | Somalia
95.5
/100
|
#96
Exceptional
2.8%
Immigrants | Afghanistan
95.3
/100
|
#97
Exceptional
2.8%
Immigrants | Honduras
95.1
/100
|
#98
Exceptional
2.8%