Serbian vs Indonesian Ambulatory Disability
COMPARE
Serbian
Indonesian
Ambulatory Disability
Ambulatory Disability Comparison
Serbians
Indonesians
6.1%
AMBULATORY DISABILITY
42.8/ 100
METRIC RATING
182nd/ 347
METRIC RANK
6.3%
AMBULATORY DISABILITY
9.9/ 100
METRIC RATING
219th/ 347
METRIC RANK
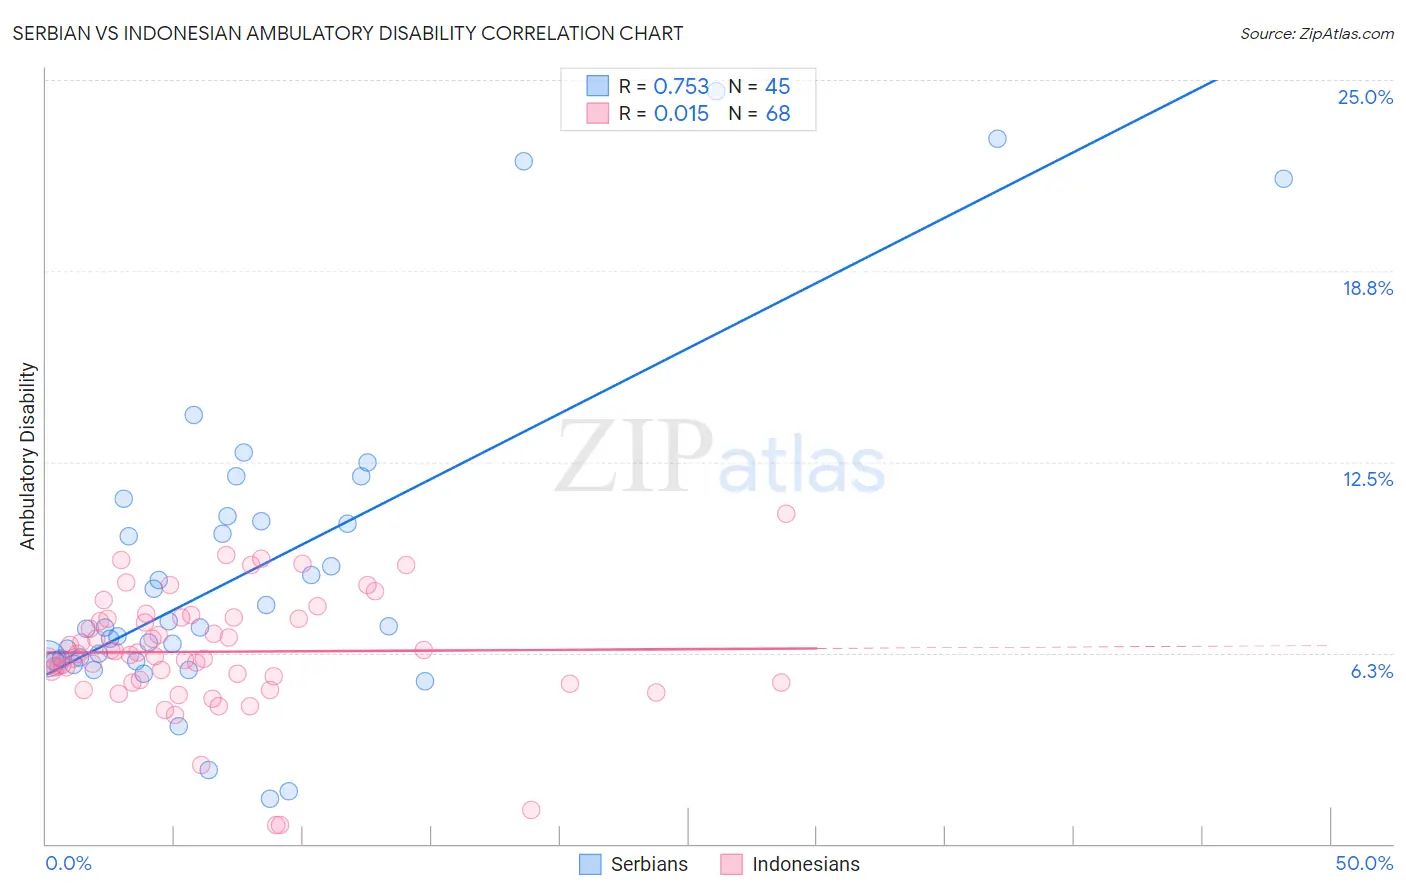
Serbian vs Indonesian Ambulatory Disability Correlation Chart
The statistical analysis conducted on geographies consisting of 267,596,356 people shows a strong positive correlation between the proportion of Serbians and percentage of population with ambulatory disability in the United States with a correlation coefficient (R) of 0.753 and weighted average of 6.1%. Similarly, the statistical analysis conducted on geographies consisting of 162,682,177 people shows no correlation between the proportion of Indonesians and percentage of population with ambulatory disability in the United States with a correlation coefficient (R) of 0.015 and weighted average of 6.3%, a difference of 2.5%.
Ambulatory Disability Correlation Summary
| Measurement | Serbian | Indonesian |
| Minimum | 1.5% | 0.59% |
| Maximum | 24.6% | 10.8% |
| Range | 23.2% | 10.2% |
| Mean | 9.0% | 6.3% |
| Median | 7.1% | 6.2% |
| Interquartile 25% (IQ1) | 6.0% | 5.3% |
| Interquartile 75% (IQ3) | 10.6% | 7.4% |
| Interquartile Range (IQR) | 4.6% | 2.1% |
| Standard Deviation (Sample) | 5.2% | 1.9% |
| Standard Deviation (Population) | 5.2% | 1.9% |
Similar Demographics by Ambulatory Disability
Demographics Similar to Serbians by Ambulatory Disability
In terms of ambulatory disability, the demographic groups most similar to Serbians are Swiss (6.1%, a difference of 0.010%), Immigrants from Thailand (6.1%, a difference of 0.030%), Immigrants from Nicaragua (6.1%, a difference of 0.060%), Austrian (6.1%, a difference of 0.070%), and Scandinavian (6.1%, a difference of 0.090%).
| Demographics | Rating | Rank | Ambulatory Disability |
| Vietnamese | 47.2 /100 | #175 | Average 6.1% |
| Immigrants | North America | 45.6 /100 | #176 | Average 6.1% |
| Immigrants | England | 45.4 /100 | #177 | Average 6.1% |
| Scandinavians | 44.5 /100 | #178 | Average 6.1% |
| Austrians | 44.1 /100 | #179 | Average 6.1% |
| Immigrants | Nicaragua | 43.9 /100 | #180 | Average 6.1% |
| Swiss | 43.1 /100 | #181 | Average 6.1% |
| Serbians | 42.8 /100 | #182 | Average 6.1% |
| Immigrants | Thailand | 42.2 /100 | #183 | Average 6.1% |
| Immigrants | Ghana | 41.2 /100 | #184 | Average 6.1% |
| Immigrants | Bosnia and Herzegovina | 37.2 /100 | #185 | Fair 6.2% |
| Europeans | 36.2 /100 | #186 | Fair 6.2% |
| Carpatho Rusyns | 35.3 /100 | #187 | Fair 6.2% |
| British | 34.3 /100 | #188 | Fair 6.2% |
| Ukrainians | 34.0 /100 | #189 | Fair 6.2% |
Demographics Similar to Indonesians by Ambulatory Disability
In terms of ambulatory disability, the demographic groups most similar to Indonesians are Immigrants from Albania (6.3%, a difference of 0.040%), Hungarian (6.3%, a difference of 0.050%), German Russian (6.3%, a difference of 0.070%), Guamanian/Chamorro (6.3%, a difference of 0.10%), and Canadian (6.3%, a difference of 0.14%).
| Demographics | Rating | Rank | Ambulatory Disability |
| Mexican American Indians | 12.0 /100 | #212 | Poor 6.3% |
| Japanese | 12.0 /100 | #213 | Poor 6.3% |
| Immigrants | Mexico | 11.0 /100 | #214 | Poor 6.3% |
| Immigrants | Latin America | 11.0 /100 | #215 | Poor 6.3% |
| Canadians | 10.9 /100 | #216 | Poor 6.3% |
| Yugoslavians | 10.9 /100 | #217 | Poor 6.3% |
| Guamanians/Chamorros | 10.6 /100 | #218 | Poor 6.3% |
| Indonesians | 9.9 /100 | #219 | Tragic 6.3% |
| Immigrants | Albania | 9.6 /100 | #220 | Tragic 6.3% |
| Hungarians | 9.6 /100 | #221 | Tragic 6.3% |
| German Russians | 9.4 /100 | #222 | Tragic 6.3% |
| Immigrants | Honduras | 7.6 /100 | #223 | Tragic 6.3% |
| Liberians | 7.1 /100 | #224 | Tragic 6.3% |
| Hondurans | 6.3 /100 | #225 | Tragic 6.3% |
| Slavs | 5.1 /100 | #226 | Tragic 6.4% |