Seminole vs Portuguese Disability Age 18 to 34
COMPARE
Seminole
Portuguese
Disability Age 18 to 34
Disability Age 18 to 34 Comparison
Seminole
Portuguese
8.4%
DISABILITY AGE 18 TO 34
0.0/ 100
METRIC RATING
335th/ 347
METRIC RANK
7.4%
DISABILITY AGE 18 TO 34
0.1/ 100
METRIC RATING
268th/ 347
METRIC RANK
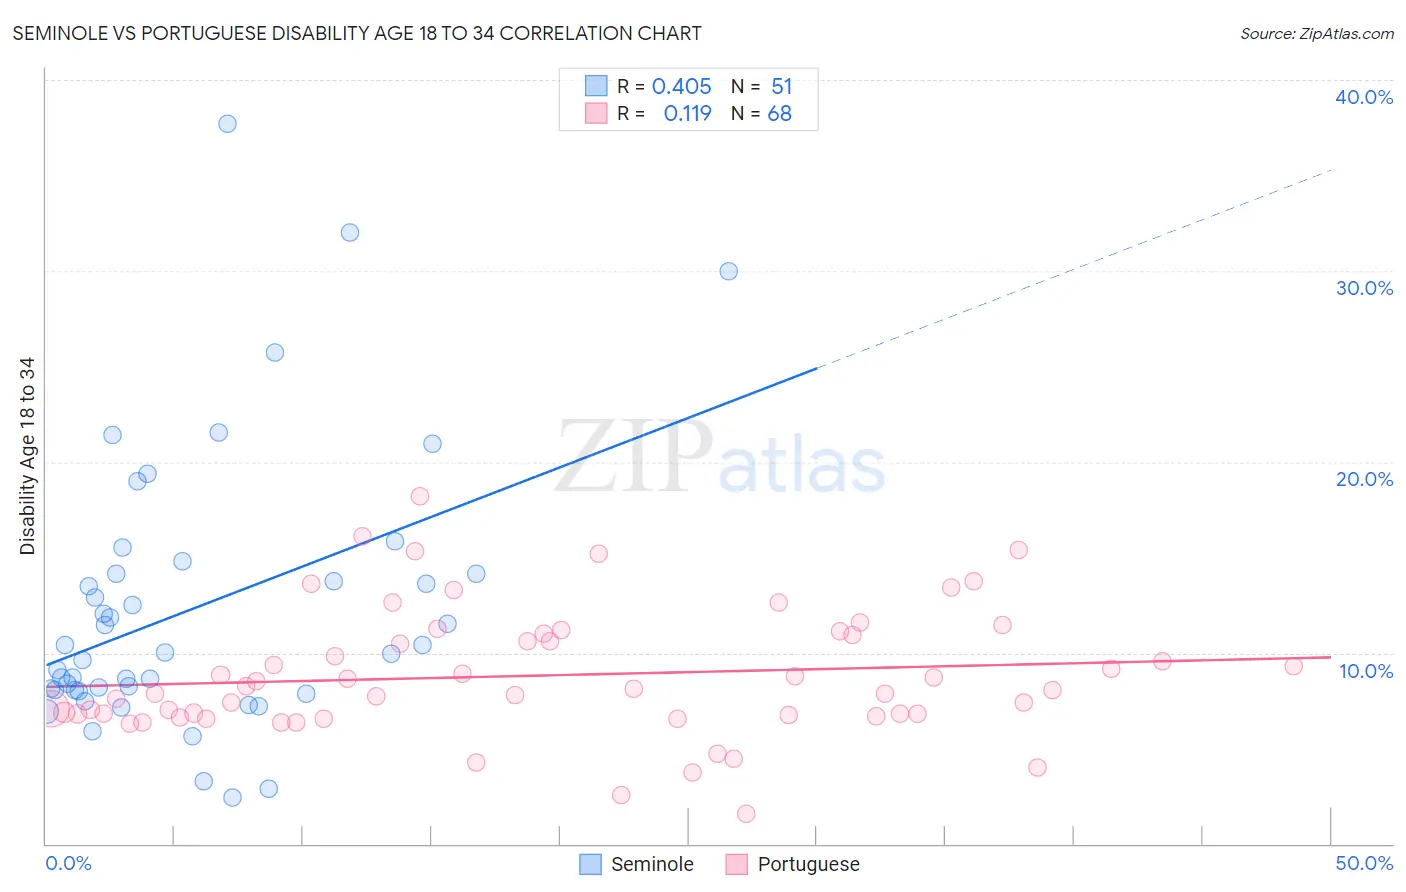
Seminole vs Portuguese Disability Age 18 to 34 Correlation Chart
The statistical analysis conducted on geographies consisting of 118,263,195 people shows a moderate positive correlation between the proportion of Seminole and percentage of population with a disability between the ages 18 and 35 in the United States with a correlation coefficient (R) of 0.405 and weighted average of 8.4%. Similarly, the statistical analysis conducted on geographies consisting of 448,622,117 people shows a poor positive correlation between the proportion of Portuguese and percentage of population with a disability between the ages 18 and 35 in the United States with a correlation coefficient (R) of 0.119 and weighted average of 7.4%, a difference of 14.6%.
Disability Age 18 to 34 Correlation Summary
| Measurement | Seminole | Portuguese |
| Minimum | 2.4% | 1.6% |
| Maximum | 37.7% | 18.2% |
| Range | 35.3% | 16.6% |
| Mean | 12.4% | 8.8% |
| Median | 10.0% | 8.1% |
| Interquartile 25% (IQ1) | 8.1% | 6.7% |
| Interquartile 75% (IQ3) | 14.2% | 10.9% |
| Interquartile Range (IQR) | 6.1% | 4.2% |
| Standard Deviation (Sample) | 7.2% | 3.3% |
| Standard Deviation (Population) | 7.2% | 3.3% |
Similar Demographics by Disability Age 18 to 34
Demographics Similar to Seminole by Disability Age 18 to 34
In terms of disability age 18 to 34, the demographic groups most similar to Seminole are Dutch West Indian (8.4%, a difference of 0.11%), Apache (8.4%, a difference of 0.33%), Immigrants from the Azores (8.5%, a difference of 1.2%), Puget Sound Salish (8.3%, a difference of 1.4%), and Comanche (8.3%, a difference of 1.6%).
| Demographics | Rating | Rank | Disability Age 18 to 34 |
| Delaware | 0.0 /100 | #328 | Tragic 8.2% |
| Crow | 0.0 /100 | #329 | Tragic 8.3% |
| Osage | 0.0 /100 | #330 | Tragic 8.3% |
| Comanche | 0.0 /100 | #331 | Tragic 8.3% |
| Puget Sound Salish | 0.0 /100 | #332 | Tragic 8.3% |
| Apache | 0.0 /100 | #333 | Tragic 8.4% |
| Dutch West Indians | 0.0 /100 | #334 | Tragic 8.4% |
| Seminole | 0.0 /100 | #335 | Tragic 8.4% |
| Immigrants | Azores | 0.0 /100 | #336 | Tragic 8.5% |
| Ottawa | 0.0 /100 | #337 | Tragic 8.6% |
| Cherokee | 0.0 /100 | #338 | Tragic 8.7% |
| Kiowa | 0.0 /100 | #339 | Tragic 8.8% |
| Choctaw | 0.0 /100 | #340 | Tragic 9.0% |
| Chickasaw | 0.0 /100 | #341 | Tragic 9.0% |
| Yakama | 0.0 /100 | #342 | Tragic 9.0% |
Demographics Similar to Portuguese by Disability Age 18 to 34
In terms of disability age 18 to 34, the demographic groups most similar to Portuguese are Basque (7.4%, a difference of 0.040%), Bangladeshi (7.4%, a difference of 0.080%), Belgian (7.4%, a difference of 0.13%), German Russian (7.4%, a difference of 0.14%), and Swiss (7.4%, a difference of 0.18%).
| Demographics | Rating | Rank | Disability Age 18 to 34 |
| Northern Europeans | 0.2 /100 | #261 | Tragic 7.3% |
| Canadians | 0.2 /100 | #262 | Tragic 7.3% |
| British | 0.2 /100 | #263 | Tragic 7.3% |
| Bermudans | 0.1 /100 | #264 | Tragic 7.3% |
| Slovenes | 0.1 /100 | #265 | Tragic 7.3% |
| German Russians | 0.1 /100 | #266 | Tragic 7.4% |
| Bangladeshis | 0.1 /100 | #267 | Tragic 7.4% |
| Portuguese | 0.1 /100 | #268 | Tragic 7.4% |
| Basques | 0.1 /100 | #269 | Tragic 7.4% |
| Belgians | 0.1 /100 | #270 | Tragic 7.4% |
| Swiss | 0.1 /100 | #271 | Tragic 7.4% |
| Tsimshian | 0.1 /100 | #272 | Tragic 7.4% |
| Slavs | 0.1 /100 | #273 | Tragic 7.4% |
| Africans | 0.1 /100 | #274 | Tragic 7.4% |
| Immigrants | Somalia | 0.1 /100 | #275 | Tragic 7.4% |