Seminole vs Immigrants from Norway Disability Age Over 75
COMPARE
Seminole
Immigrants from Norway
Disability Age Over 75
Disability Age Over 75 Comparison
Seminole
Immigrants from Norway
51.5%
DISABILITY AGE OVER 75
0.0/ 100
METRIC RATING
318th/ 347
METRIC RANK
45.9%
DISABILITY AGE OVER 75
99.5/ 100
METRIC RATING
63rd/ 347
METRIC RANK
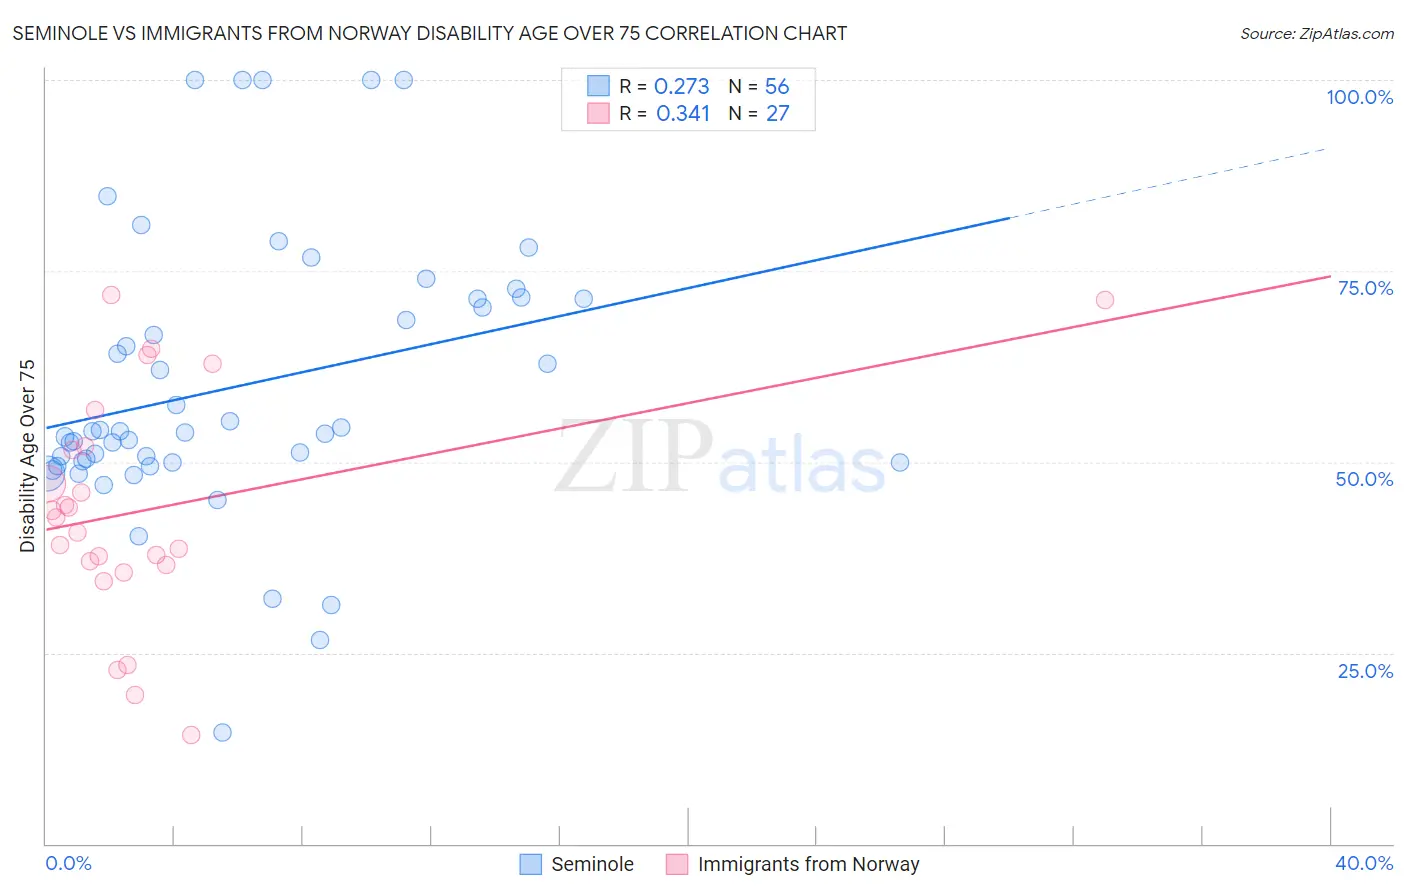
Seminole vs Immigrants from Norway Disability Age Over 75 Correlation Chart
The statistical analysis conducted on geographies consisting of 118,267,325 people shows a weak positive correlation between the proportion of Seminole and percentage of population with a disability over the age of 75 in the United States with a correlation coefficient (R) of 0.273 and weighted average of 51.5%. Similarly, the statistical analysis conducted on geographies consisting of 116,660,458 people shows a mild positive correlation between the proportion of Immigrants from Norway and percentage of population with a disability over the age of 75 in the United States with a correlation coefficient (R) of 0.341 and weighted average of 45.9%, a difference of 12.0%.
Disability Age Over 75 Correlation Summary
| Measurement | Seminole | Immigrants from Norway |
| Minimum | 14.6% | 14.3% |
| Maximum | 100.0% | 71.9% |
| Range | 85.4% | 57.6% |
| Mean | 59.9% | 43.7% |
| Median | 53.9% | 42.7% |
| Interquartile 25% (IQ1) | 50.0% | 36.5% |
| Interquartile 75% (IQ3) | 71.4% | 52.0% |
| Interquartile Range (IQR) | 21.4% | 15.5% |
| Standard Deviation (Sample) | 18.4% | 14.9% |
| Standard Deviation (Population) | 18.2% | 14.6% |
Similar Demographics by Disability Age Over 75
Demographics Similar to Seminole by Disability Age Over 75
In terms of disability age over 75, the demographic groups most similar to Seminole are Creek (51.5%, a difference of 0.0%), Paiute (51.5%, a difference of 0.14%), Dutch West Indian (51.5%, a difference of 0.15%), Yakama (51.3%, a difference of 0.33%), and Comanche (51.7%, a difference of 0.49%).
| Demographics | Rating | Rank | Disability Age Over 75 |
| Cajuns | 0.0 /100 | #311 | Tragic 50.7% |
| Cheyenne | 0.0 /100 | #312 | Tragic 50.9% |
| Immigrants | Azores | 0.0 /100 | #313 | Tragic 50.9% |
| Immigrants | Mexico | 0.0 /100 | #314 | Tragic 51.1% |
| Mexicans | 0.0 /100 | #315 | Tragic 51.1% |
| Chickasaw | 0.0 /100 | #316 | Tragic 51.2% |
| Yakama | 0.0 /100 | #317 | Tragic 51.3% |
| Seminole | 0.0 /100 | #318 | Tragic 51.5% |
| Creek | 0.0 /100 | #319 | Tragic 51.5% |
| Paiute | 0.0 /100 | #320 | Tragic 51.5% |
| Dutch West Indians | 0.0 /100 | #321 | Tragic 51.5% |
| Comanche | 0.0 /100 | #322 | Tragic 51.7% |
| Immigrants | Yemen | 0.0 /100 | #323 | Tragic 52.0% |
| Menominee | 0.0 /100 | #324 | Tragic 52.3% |
| Immigrants | Cabo Verde | 0.0 /100 | #325 | Tragic 52.4% |
Demographics Similar to Immigrants from Norway by Disability Age Over 75
In terms of disability age over 75, the demographic groups most similar to Immigrants from Norway are Immigrants from North Macedonia (45.9%, a difference of 0.0%), Austrian (46.0%, a difference of 0.040%), Burmese (45.9%, a difference of 0.050%), Immigrants from England (46.0%, a difference of 0.050%), and Immigrants from Argentina (45.9%, a difference of 0.070%).
| Demographics | Rating | Rank | Disability Age Over 75 |
| Immigrants | Netherlands | 99.6 /100 | #56 | Exceptional 45.9% |
| Immigrants | Turkey | 99.6 /100 | #57 | Exceptional 45.9% |
| Immigrants | Israel | 99.6 /100 | #58 | Exceptional 45.9% |
| Iranians | 99.6 /100 | #59 | Exceptional 45.9% |
| Immigrants | Europe | 99.6 /100 | #60 | Exceptional 45.9% |
| Immigrants | Argentina | 99.6 /100 | #61 | Exceptional 45.9% |
| Burmese | 99.5 /100 | #62 | Exceptional 45.9% |
| Immigrants | Norway | 99.5 /100 | #63 | Exceptional 45.9% |
| Immigrants | North Macedonia | 99.5 /100 | #64 | Exceptional 45.9% |
| Austrians | 99.5 /100 | #65 | Exceptional 46.0% |
| Immigrants | England | 99.5 /100 | #66 | Exceptional 46.0% |
| Immigrants | Spain | 99.4 /100 | #67 | Exceptional 46.0% |
| Immigrants | South Central Asia | 99.4 /100 | #68 | Exceptional 46.0% |
| Immigrants | Romania | 99.3 /100 | #69 | Exceptional 46.0% |
| Jordanians | 99.2 /100 | #70 | Exceptional 46.1% |