Seminole vs Immigrants from Eritrea Cognitive Disability
COMPARE
Seminole
Immigrants from Eritrea
Cognitive Disability
Cognitive Disability Comparison
Seminole
Immigrants from Eritrea
18.3%
COGNITIVE DISABILITY
0.0/ 100
METRIC RATING
306th/ 347
METRIC RANK
18.3%
COGNITIVE DISABILITY
0.0/ 100
METRIC RATING
304th/ 347
METRIC RANK
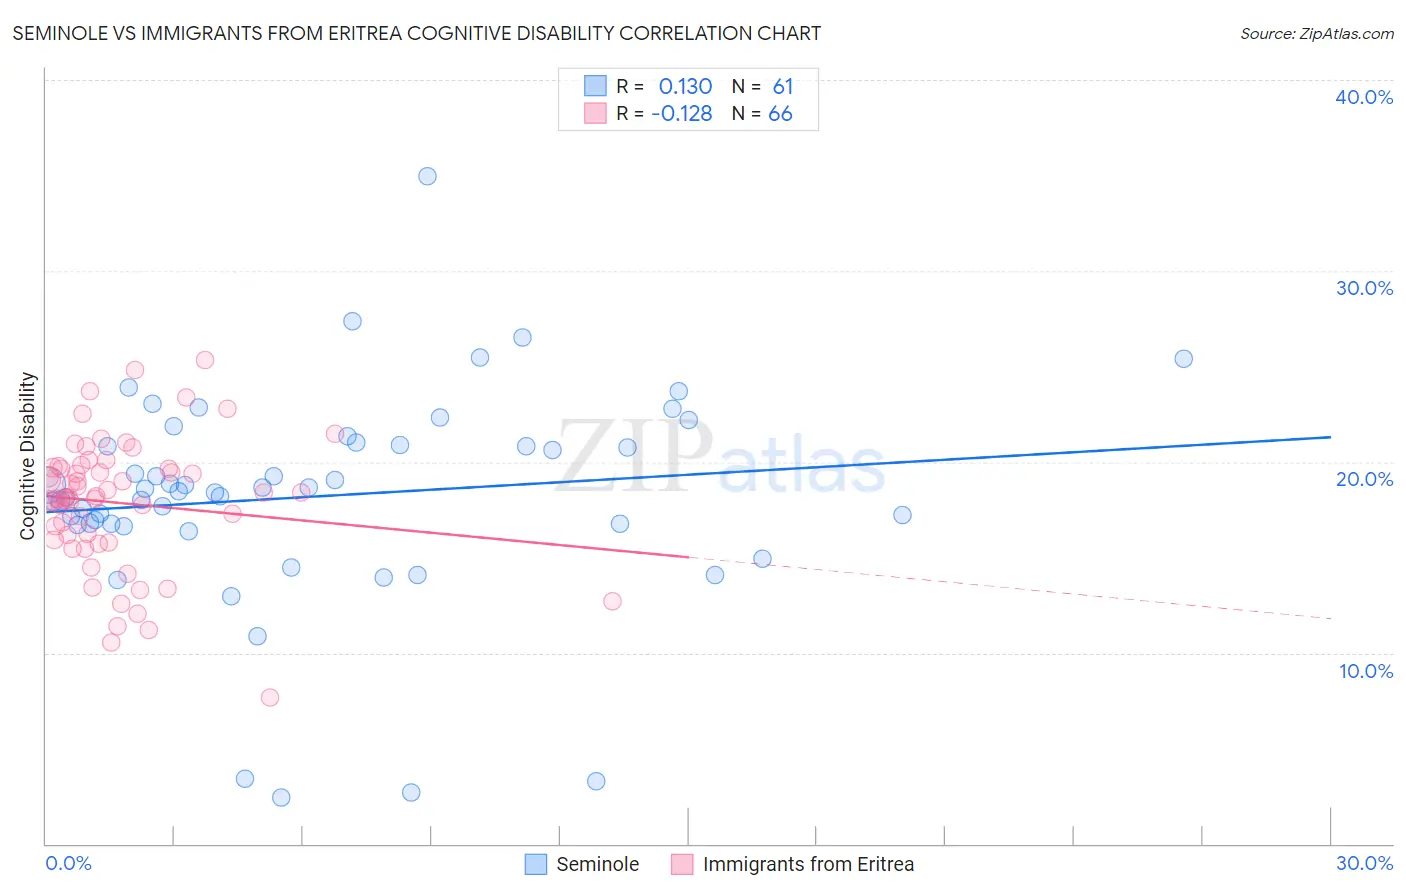
Seminole vs Immigrants from Eritrea Cognitive Disability Correlation Chart
The statistical analysis conducted on geographies consisting of 118,309,503 people shows a poor positive correlation between the proportion of Seminole and percentage of population with cognitive disability in the United States with a correlation coefficient (R) of 0.130 and weighted average of 18.3%. Similarly, the statistical analysis conducted on geographies consisting of 104,852,207 people shows a poor negative correlation between the proportion of Immigrants from Eritrea and percentage of population with cognitive disability in the United States with a correlation coefficient (R) of -0.128 and weighted average of 18.3%, a difference of 0.13%.
Cognitive Disability Correlation Summary
| Measurement | Seminole | Immigrants from Eritrea |
| Minimum | 2.4% | 7.7% |
| Maximum | 35.0% | 25.3% |
| Range | 32.5% | 17.7% |
| Mean | 18.2% | 17.8% |
| Median | 18.5% | 18.2% |
| Interquartile 25% (IQ1) | 16.7% | 15.9% |
| Interquartile 75% (IQ3) | 21.0% | 19.7% |
| Interquartile Range (IQR) | 4.2% | 3.8% |
| Standard Deviation (Sample) | 5.6% | 3.4% |
| Standard Deviation (Population) | 5.6% | 3.4% |
Demographics Similar to Seminole and Immigrants from Eritrea by Cognitive Disability
In terms of cognitive disability, the demographic groups most similar to Seminole are Ugandan (18.3%, a difference of 0.0%), Colville (18.3%, a difference of 0.010%), Immigrants from Western Africa (18.4%, a difference of 0.090%), Immigrants from Eastern Africa (18.4%, a difference of 0.13%), and Immigrants from Kenya (18.3%, a difference of 0.18%). Similarly, the demographic groups most similar to Immigrants from Eritrea are Immigrants from Kenya (18.3%, a difference of 0.050%), Barbadian (18.3%, a difference of 0.060%), Colville (18.3%, a difference of 0.12%), Ugandan (18.3%, a difference of 0.13%), and Immigrants from Ghana (18.3%, a difference of 0.15%).
| Demographics | Rating | Rank | Cognitive Disability |
| German Russians | 0.0 /100 | #295 | Tragic 18.2% |
| Immigrants | Burma/Myanmar | 0.0 /100 | #296 | Tragic 18.2% |
| Blackfeet | 0.0 /100 | #297 | Tragic 18.3% |
| Japanese | 0.0 /100 | #298 | Tragic 18.3% |
| Ghanaians | 0.0 /100 | #299 | Tragic 18.3% |
| Creek | 0.0 /100 | #300 | Tragic 18.3% |
| Immigrants | Ghana | 0.0 /100 | #301 | Tragic 18.3% |
| Barbadians | 0.0 /100 | #302 | Tragic 18.3% |
| Immigrants | Kenya | 0.0 /100 | #303 | Tragic 18.3% |
| Immigrants | Eritrea | 0.0 /100 | #304 | Tragic 18.3% |
| Colville | 0.0 /100 | #305 | Tragic 18.3% |
| Seminole | 0.0 /100 | #306 | Tragic 18.3% |
| Ugandans | 0.0 /100 | #307 | Tragic 18.3% |
| Immigrants | Western Africa | 0.0 /100 | #308 | Tragic 18.4% |
| Immigrants | Eastern Africa | 0.0 /100 | #309 | Tragic 18.4% |
| Choctaw | 0.0 /100 | #310 | Tragic 18.4% |
| Hmong | 0.0 /100 | #311 | Tragic 18.4% |
| Chickasaw | 0.0 /100 | #312 | Tragic 18.5% |
| Yaqui | 0.0 /100 | #313 | Tragic 18.5% |
| Sub-Saharan Africans | 0.0 /100 | #314 | Tragic 18.5% |
| Immigrants | Dominica | 0.0 /100 | #315 | Tragic 18.6% |